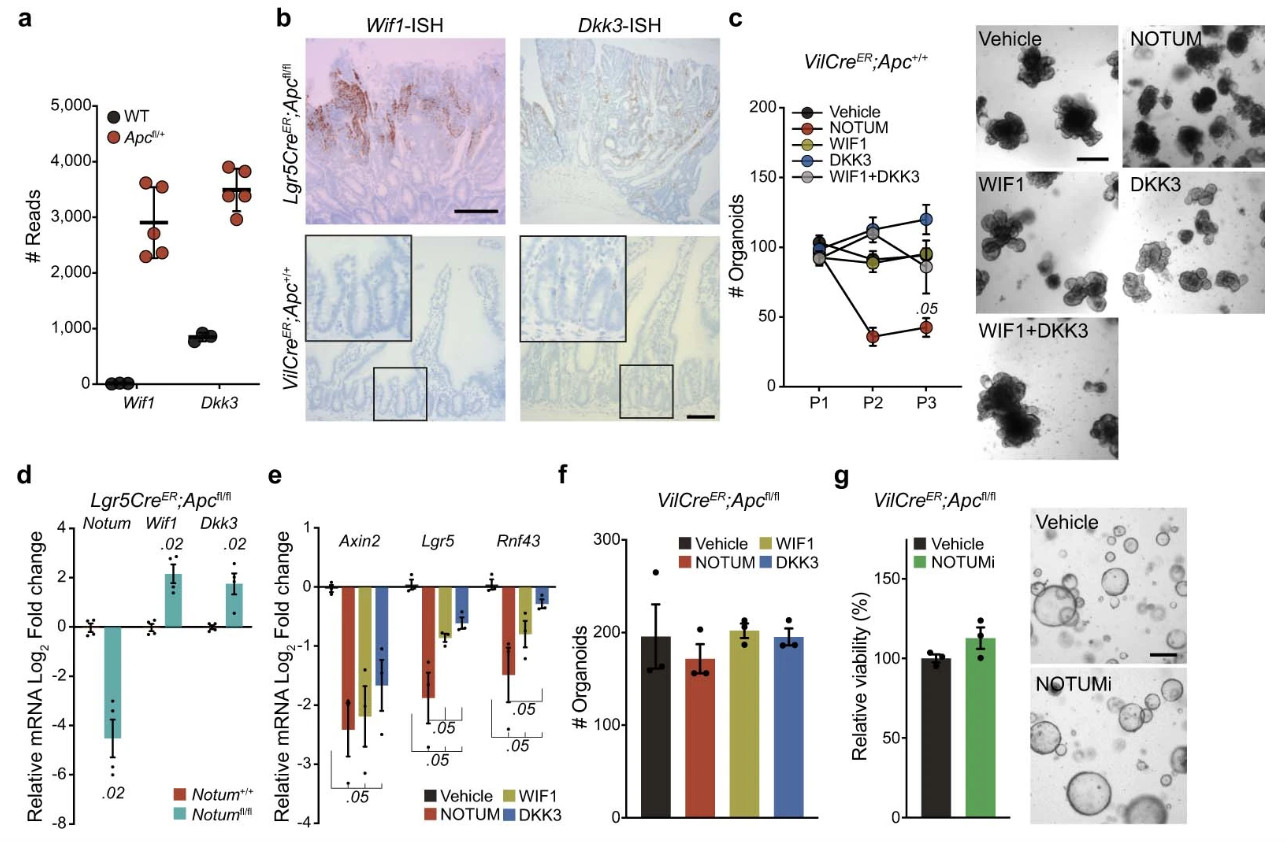
Extended Data Figure 2. Apc-mutant cells upregulate negative regulators of Wnt signalling.

a, Raw sequence reads for transcripts encoding Wnt-negative regulators, Wif1 and Dkk3, in Apc-mutant (VilCreER;Apcfl/+) tumour tissue compared to wild-type (WT) small intestine (n=3 WT mice, n=5 VilCreER;Apcfl/+mice). b, Representative ISH for Wif1 and Dkk3 in Lgr5CreER;Apcfl/fl tumour (top panels) and WT small intestine (bottom panels). n=3 mice. Images of mice shown aged between 3–4 months. Boxed areas show close-up of WT crypts. Scale bar, 200 μm. For fluorescence-activated cell sorting (FACS) gating strategy, see Supplementary Fig. 1. c, Quantification and representative images of WT organoids, formed over multiple passages (P1, P2, and P3), during culture supplemented with recombinant WIF1, DKK3, and NOTUM. WT organoids treated with recombinant proteins were derived from n=3 mice. Images taken at P2. Mann–Whitney one-tailed U-test. Scale bar, 200 μm. d, qPCR for Wnt antagonists expressed by tamoxifen-induced Lgr5CreER;Apcfl/fl (Notum+/+) and Lgr5CreER;Apcfl/fl;Notumfl/fl (Notumfl/fl) small intestinal organoids. n=4 mice per genotype. e, qPCR for Wnt targets expressed in WT organoids 3 days following treatment with indicated recombinant Wnt antagonists. n=3 mice per treatment. Mann–Whitney one-tailed U-test. f, Quantification of VilCreER;Apcfl/fl organoids 3 days after culture with recombinant WIF1, DKK3, and NOTUM. n=3 mice per condition. g, Relative organoid viability and representative images of VilCreER;Apcfl/fl intestinal organoids treated with vehicle or NOTUMi for 3 days. n=3 mice/condition. Scale bar, 100 μm. Data are mean ± s.e.m. In d, Mann–Whitney two-tailed U-test; P values are shown in the corresponding panels.
