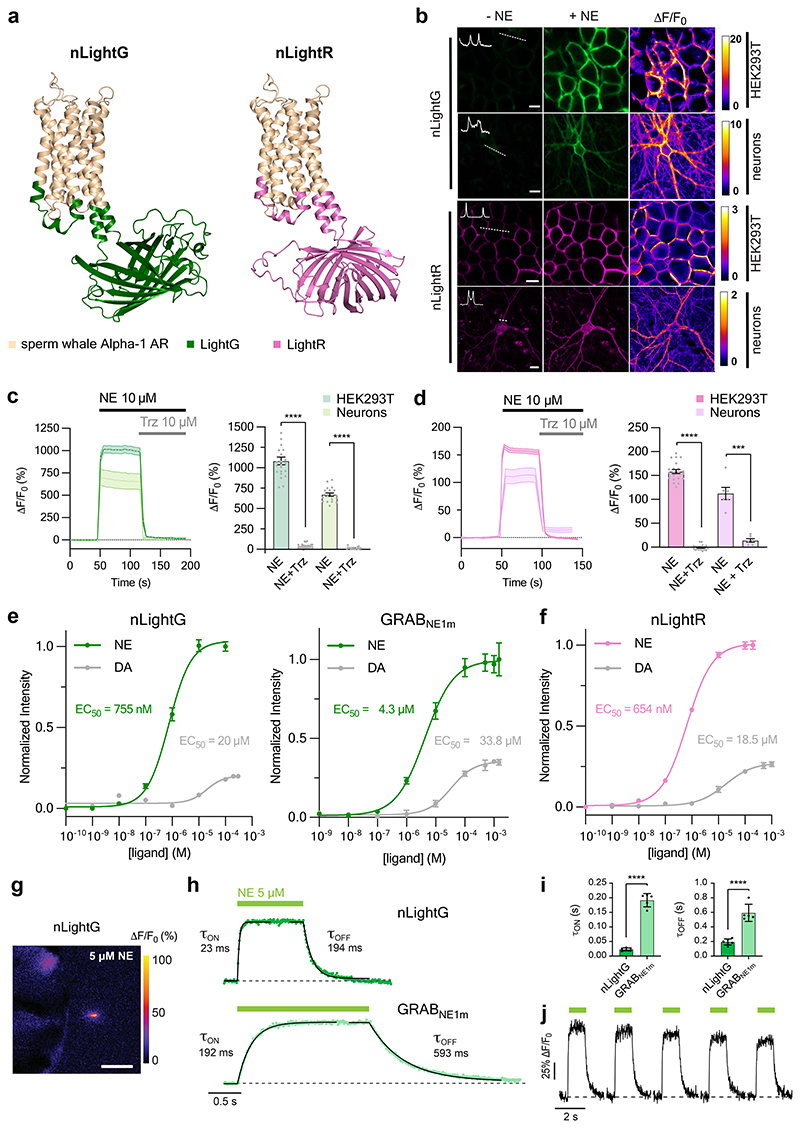
Figure 1. In vitro properties of nLightG and nLightR.
a, Structural models of nLightG (left) and nLightR (right) generated using ColabFold39. b, Representative images of HEK293T cells and neurons expressing nLightG or nLightR before/after application of NE (10 μM) and corresponding pixel-wise ΔF/F0 heatmaps. White insets indicate surface expression of the indicators. Scale bars, 10 μm (HEK293T), 20 μm (neurons). c, Left, timelapse of fluorescence of response (ΔF/F0) of nLightG in HEK293T (dark green) or neurons (light green) upon application of NE (10 μM) followed by application of trazodone (Trz, 10 μM). Right, quantification of maximal ΔF/F0 responses from left. Two-tailed Students t-test with Welch’s correction. n = 3 independent experiments with n=22 cells (HEK293T), n=18 cells (neurons). P = 2.979×10⁻¹⁶ (HEK293T), P = 8.558×10⁻¹⁷ (neurons). d, Same as in c for nLightR. n = 3 independent experiments with n = 21 cells (HEK293T), n=6 cells (neurons). P = 5.922×10⁻³² (HEK293T), P = 0.004 (neurons). e, Fluorescence dose-response curves of nLightG (left) and GRABNE1m (right) for NE and DA in HEK293T cells normalized to the maximum ΔF/F0 for NE for each indicator. Datapoints were fitted with four-parameter dose-response curves to determine EC50 values. n=6,5,3 wells for nLightG with NE, nLightG with DA, and GRABNE with NE/DA, respectively. f, Same as in e for nLightR with n=3 wells. All data are shown as mean ± SEM. g, Representative heatmap of nLightG fluorescence response (ΔF/F0 %) in an outside-out membrane patch from nLightG-expressing HEK293T cells (n = 6 independent experiments). Scale bar, 50 μm. h, ON and OFF kinetics of nLightG (top) and GRABNE1m (bottom) after ultrafast (<0.5 ms) switching of the perfusion pipette. Dots represent the average of 5 applications. Kinetic parameters were obtained using single-exponential fits on the average of all trials. i, Statistical comparison of kinetic parameters. Unpaired two-tailed Student’s t test. n=6 and 5 patches for nLightG and GRABNE1m, respectively. P = 3.0 ×10⁻⁸ (τON), P = 2.7 ×10⁻⁵ (τOFF). Mean ± standard deviation are shown. j, Five consecutive NE applications on nLightG (5 μM, 1 s). Images were acquired at 100 Hz. All experiments were repeated at least three times with similar results.

