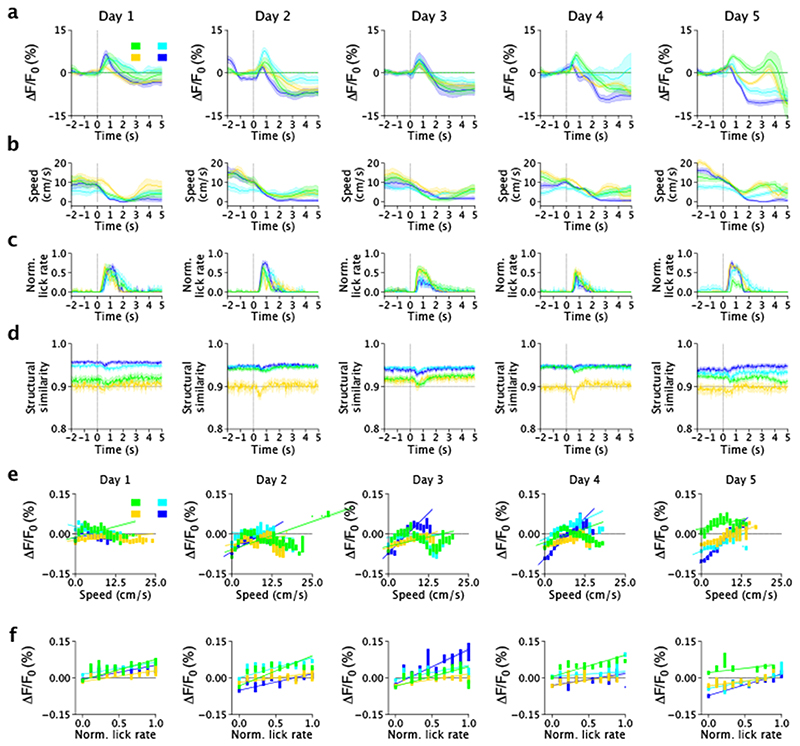
Extended Data Fig. 7. nLightG signals associated with reward position in the mouse hippocampus.
a, Event-triggered averages for individual animals (n = 4) showing the changes in nLightG signal amplitude over the whole field-of-view when the mouse crossed the reward position for the five consecutive days of recording. Signals were recorded using two-photon microscopy. The colors indicate the different animals (subject 1-4). b, Event-triggered averages of running speed of individual animals in the virtual corridor when the mouse crossed the reward position. Color code as in a. c, Same as in b for lick rate. d, Structural similarity in the time interval displayed in a-c. e, nLightG signal amplitude as a function of running speed for individual animals. f, nLightG signal amplitude as a function of lick rate for individual animals.

