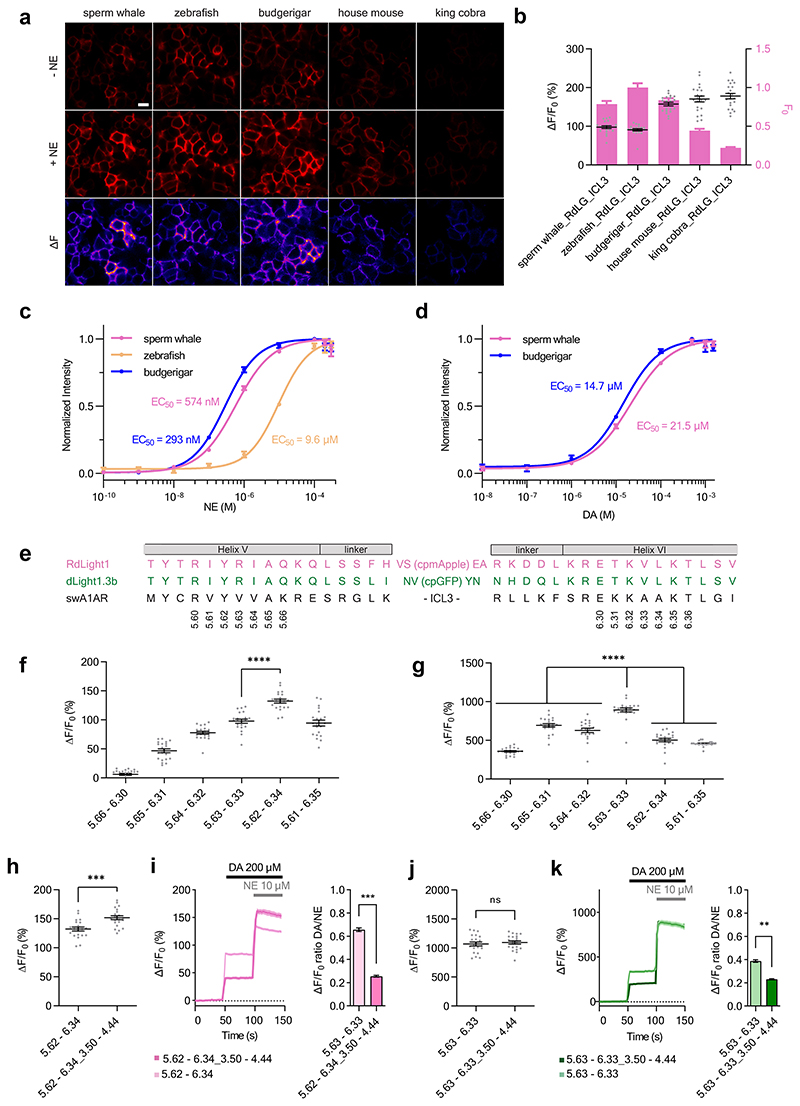
Extended Data Fig. 1. Development of nLightG and nLightR.
a, Representative images of indicators, generated by grafting LightR from residue 5.63 to residue 6.33 onto Alpha-1 ARs from five different species, expressed in HEK293T cells and imaged in the absence and presence of NE (10 μM). Heatmaps represent the pixelwise absolute change in fluorescence intensity upon addition of NE. b, Quantification of the basal brightness and the dynamic range upon addition of NE (10 μM) to HEK293T cells expressing the five prototype indicators. n = 21 cells. c, d, Normalized fluorescence intensity dose-response curves of nLightG and nLightR for NE (c) and DA (d) in HEK293T cells. Datapoints were fitted with four-parameter dose-response curves to determine the EC50 values. n = 3 wells per concentration for each ligand. e, Partial alignment of the amino acid sequence of RdLight1, dLight1.3b and the sperm whale Alpha-1 AR. BW numbering is shown for the residues involved in grafting registry optimization. f, g, Dynamic range of indicator variants generated by grafting of the cpmApple module of RdLight1 (f) or the cpGFP module of dLight1.3b (g) at different BW registries. The indicated BW numbers refer to the grafted part of RdLight1 or dLight1.3b replacing the equivalent part of the sperm whale Alpha-1 AR. The response was measured in HEK293T cells upon addition of NE (10 μM). n = 21 cells. P values were as follows: 1.585×10⁻⁸ (f); 5.66 - 6.30, 4.149×10⁻¹⁷; 5.65 - 6.31, 9.093×10⁻⁷; 5.64 - 6.32, 2.199×10⁻⁸; 5.62 - 6.34, 4.341×10⁻¹⁴; 5.61 - 6.35, 3.283×10⁻¹⁴ (g). h, Dynamic range of the red fluorescent swAlpha-1 AR-based indicator variants with the optimized grafting registry without or with additional grafting of the ICL2 from RdLight1. The grafted regions replacing the equivalent part of the swAlpha-1 AR are indicated with BW numbering. The response was measured in HEK293T cells upon addition of NE (10 μM). n = 21 cells. P = 2.625×10⁻⁵. i, Left, time trace of the relative fluorescent response of nLightR (with or without the ICL2 region grafted from RdLight1) transiently expressed in HEK293T. Saturating concentrations of DA (200 μM) and NE (10 μM) were added consecutively. n = 21 cells for each trace. Right, quantification of the ratio of the average fluorescent responses to DA versus NE from traces shown on left, for each indicator. P = 2.292× 10⁻⁴. j, Same as in (h) but for nLightG and using the ICL2 of dLight1.3b for grafting. P = 0.566. k, Same as in (i) but for nLightG (with or without the ICL2 region grafted from dLight1.3b). P = 2.103× 10⁻³. All data are shown as mean ± SEM and all experiments were repeated at least three times with similar results. The mean values were compared using a two-tailed Students t-test with Welch’s correction.

