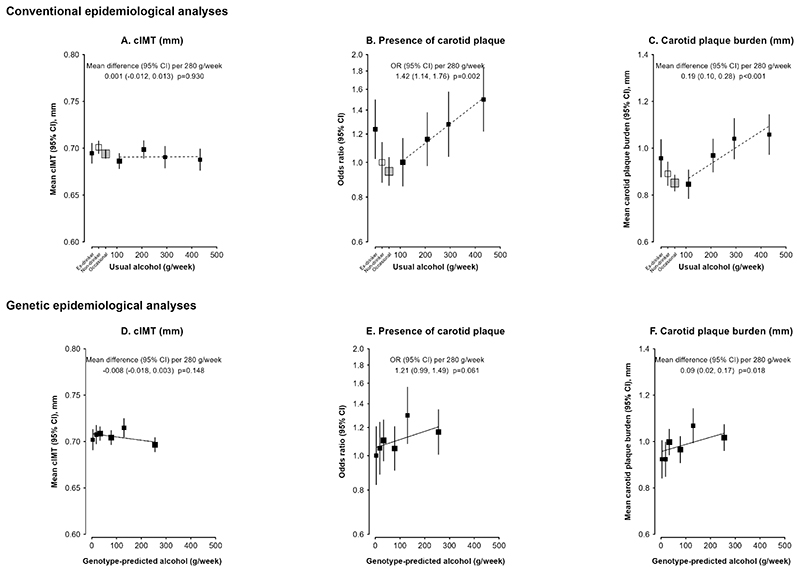
Figure 1. Associations of carotid measurements with self-reported alcohol consumption and with genotype-predicted mean alcohol intake, in men.
Conventional epidemiological analyses (A–C) of baseline self-reported drinking patterns with cIMT (A), presence of carotid plaque (B), and carotid plaque burden (C) in men without prior cardiovascular disease. The reference group was non-drinkers and results were adjusted for age, area, education, income, and smoking. The means or odds ratios for current drinkers were plotted against usual alcohol intake, with a fitted line giving the mean change or odds ratio (95% CI) per 280 g intake per week usual alcohol intake. Genetic epidemiological analyses (D–F) of genotype predicted mean alcohol intake with cIMT (D), presence of carotid plaque (E), and carotid plaque burden (F) in all men. Results were adjusted for age, area, and genomic principal components. The means or odds ratios were plotted against genotype-predicted mean alcohol intake, with the mean change or odds ratio (95% CI) per 280 g intake per week genotype-predicted mean alcohol intake calculated within study areas and combined by inverse variance-weighted meta-analysis. The area of each square is inversely proportional to the variance of the least square mean in (A, C, D, F), and the variance of the log odds in (B, E). The group-specific 95% CIs, calculated from this variance, are shown by error bars. cIMT: carotid intima media thickness; CI: confidence interval.

