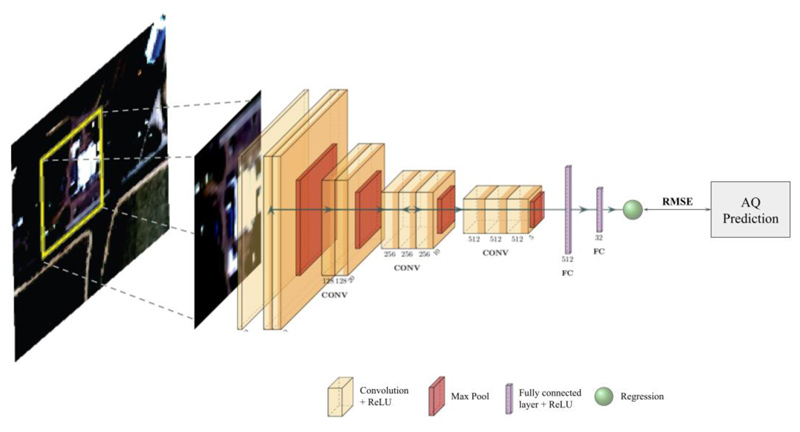
Fig. 1. Methodology Flowchart.
Single satellite imagery patches are input to the CNN 40x40 pixel (100mx100m) for PM2.5 and 80x80 pixels (200mx200m) for NO2, each patch corresponds to one target value from a continuous LUR surface. The satellite images are applied to a convolutional neural network (CNN) which consists of stacked layers of convolution and nonlinear activation functions (ReLU) (yellow blocks) followed by Max Pooling layers (Red blocks) to spatially down-sample the features at the end of each convolutional block. Lastly, the convolutional features are flattened and fed into Fully connected layers (showed in purple) and regressed to the LUR training data to predict continuous PM2.5/NO2 estimates. Root Mean Squared Error (RMSE) was used to measure the error and evaluate the model. (Further details: SI Section A.).

