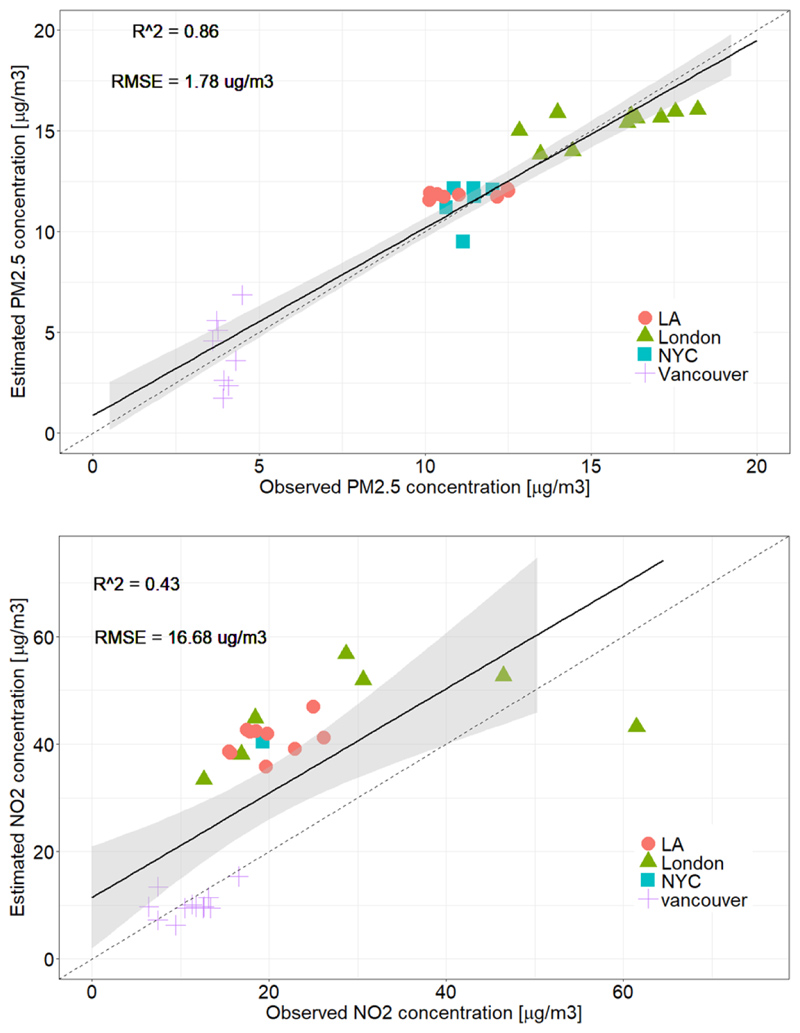
Fig. 5. Correlations between observed and predicted PM2.5 and NO2.
Correlation between observed PM2.5 (upper panel) and NO2 (lower panel) concentrations at ground monitoring sites and predicted values based on our model; the dashed line is the 1:1 line and the black line is the regression line with 95% confidence intervals (R2=0.86, 0.43, and RMSE=1.78, 16.68 μg/m3, respectively). Only sites that had co-located model-estimated values within a distance less than 500 m were included. For London, daily station data was used to calculate annual means of measured pollution over ground stations that had at least one measured value every month. For the other cities, annual means of measured data were used for the stations that had collected data for over 50% of the year.

