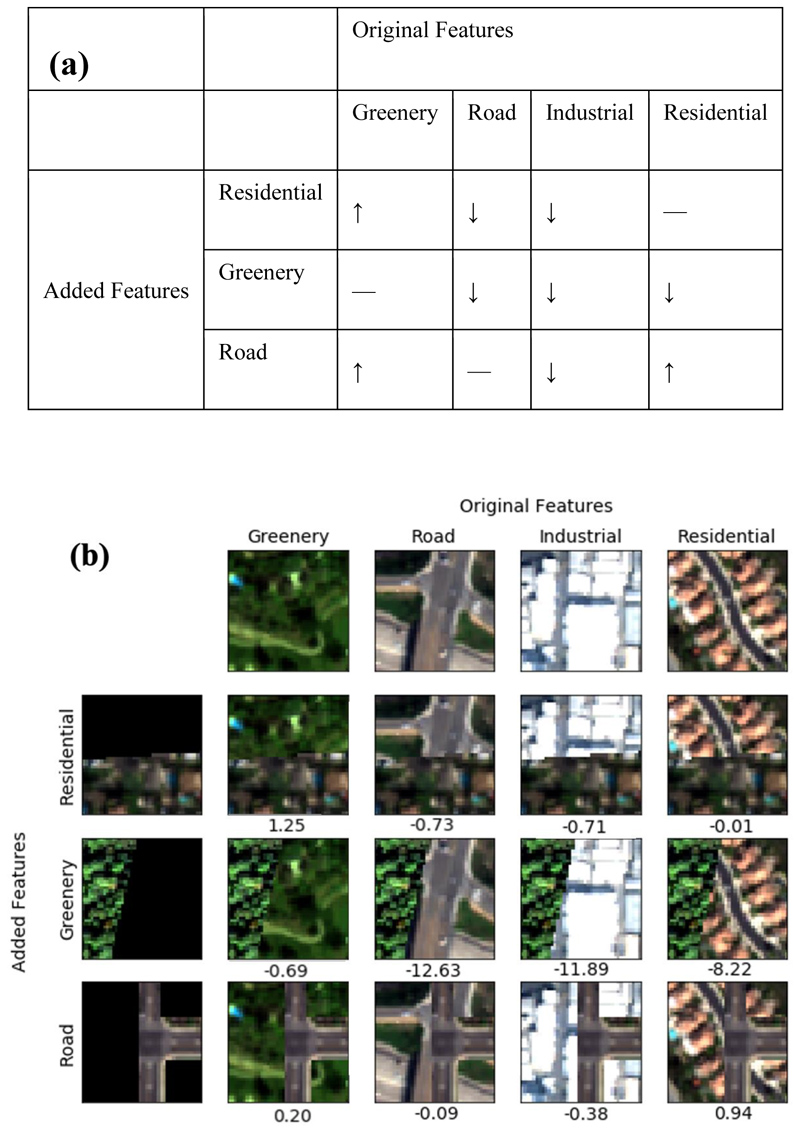
Fig. 6. Feature contribution analysis.
(a) Hypothesis of expected changes in PM2.5 concentrations (μg/m3) when adding different urban features to original imagery. (b) Confusion table following the hypothesize in subfigure (a) using satellite images with and without synthesized residential, greenery, and road features. The columns represent the original satellite images of greenery, road, industrial, and residential from left to right. From top to bottom, the rows are partial residential, greenery and road images to be overlayed on original images. We demonstrate the differences of PM2.5 levels between the original and synthesized images on the right hand of each subplot. The results in subfigure (b) are in-line with intuition demonstrated in subfigure (a) and support our hypothesize that our model is learning the non-linear relation between urban objects and pollution concentrations.

