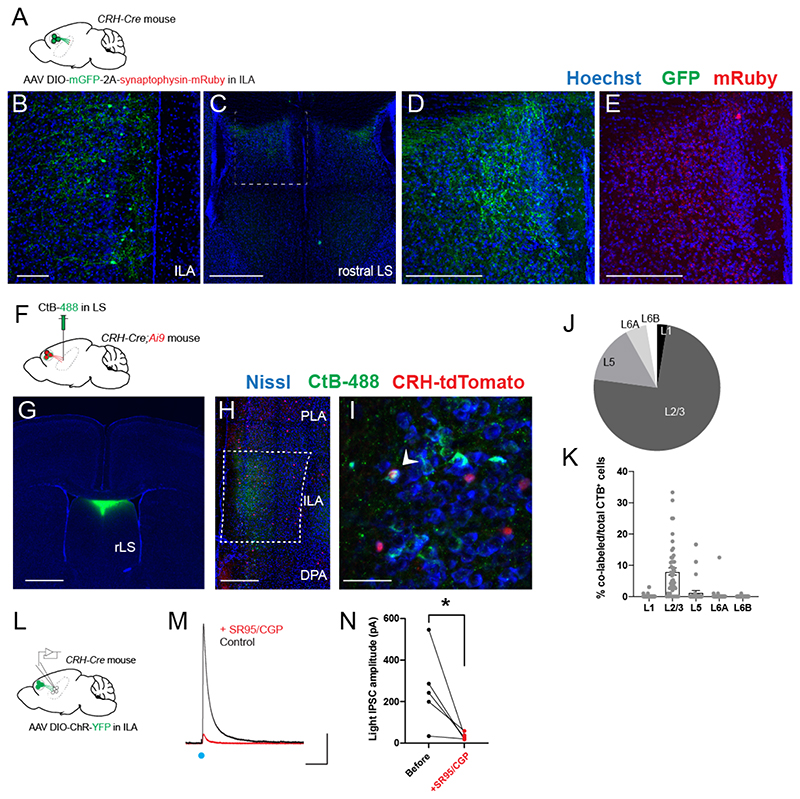
Figure 1. ILACRH cells project to rostro-dorsal LS.
A. CRH-Cre mice injected in ILA with AAV2/DJ hSyn.FLEX.mGFP.2A.Synatophysin-mRuby. B-E. Immunohistochemistry images of a ILA (B) and LS (C-E) sections labeled for GFP (B-D) or mRuby (E). Scale bars: 100 μm (B), 500 μm (C) and 200 μm (D-E). F. CRH-Cre;Ai9 mice injected in rdLS with CtB-488. G. Image of a coronal brain section containing the injection site. Scale bar: 1 mm. H-I. Images of coronal brain sections containing the mPFC. White arrowheads indicate CtB+/CRH+ cells. Scale bar: 400 μm (H), 50 μm (I). J. Distribution of CtB+ cells in ILA (6mice). K. Percentage of co-labeled tdTomato+ and CtB+ over the total number of CtB+ cells per ILA layer. Each point from a different section. 4 sections / mice, N = 6 mice. Bar graph represents mean ± S.E.M. Nested one-way ANOVA, F4,25 = 24.20, p < 0.0001. L. CRH-Cre mice injected in ILA with AAV2/9 EF1a.DIO.hChR2(E123T/T159C)-eYFP. M. Electrophysiological traces from a rdLS neuron recorded in voltage-clamp configuration at +10 mV. Blue dot, stimulation of CRH+ fibers expressing Channelrhodopsin using 1 ms pulse of blue light to elicit an IPSC before and after application of SR95 and CGP. Scale bars: 100 pA and 100 ms. N. IPSC amplitude before and after SR95 and CGP application (5 cells in 4 mice; paired t test, p = 0.04).

