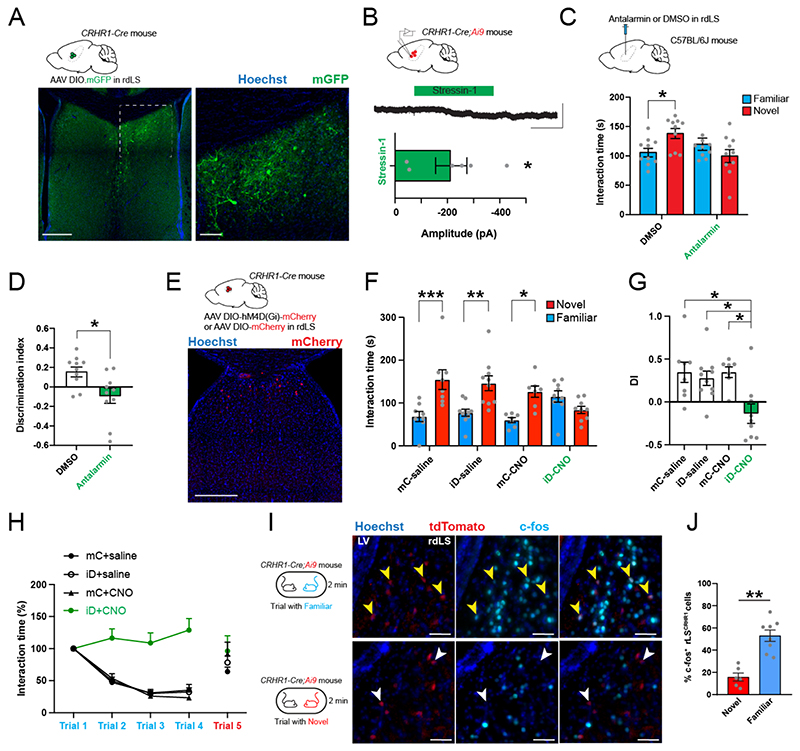
Figure 5. CRHR1+ neurons in rdLS are activated by social familiarity and regulate SNP and familiarization.
A. CRHR1-Cre mice injected in rdLS with AAV2/5 hSyn.DIO.mGFP. Scale bars: 300 μm (left), 50 μm (right). B. Whole-cell patch-clamp recording of CRHR1-tdTomato cells in rdLS of CRHR1-Cre;Ai9 mice (top). Voltage-clamp trace during bath application of 300 nM stressin-1 (middle). Scale bars: 100 pA and 2 min. Bar graph showing the amplitude of the decrease (bottom). C.C57BL/6J wild-type mice infused in rdLS with 2 μg of antalarmin dissolved in 0.6 μL of DMSO or DMSO as a control (top). Interaction time with familiar (blue) or novel (red) mouse during the recall trial of the social novelty preference test in mice infused with antalarmin or DMSO (bottom). Grey dots are different mice. 2-way ANOVA F(novelty x injection)1,36 = 7.699, p = 0.009. Sidak’s multiple comparison tests novel vs. familiar: DMSO, p = 0.04; antalarmin, p = 0.3. D. Discrimination index for social novelty preference during recall trial. Grey dots are different mice. One-sample t tests: p = 0.003 and p = 0.2. Unpaired t test:p = 0.01. E. CRHR1-Cre mice injected in rdLS with AAV2/8 hSyn.DIO.hM4D(Gi)-mCherry (iDREADD) or AAV2/8 hSyn.DIO.mCherry (top). Immunohistochemistry pictures of iD-mCherry expression in rdLS. Scale bar: 300 μm (bottom). F. Interaction time with novel (red) or familiar (blue) mouse during the recall trial of the social novelty preference test in mice expressing mCherry (mC) or hM4Di (iD). Grey dots are different mice. 3-way ANOVA F(novelty x injection x virus)1,60 = 3.845, p = 0.04. Sidak’s multiple comparison tests novel vs. familiar: mC + saline, p = 0.0003; iD + saline, p = 0.001; mC + CNO, p = 0.01; iD + CNO, p = 0.4. G. Discrimination indexes for social novelty preference of the four groups during recall trial. One-sample t tests compared to 0: mC + saline, p = 0.02; iD + saline, p = 0.009; mC + CNO, p = 0.001; iD + CNO, p = 0.3. 2-way ANOVA: F(virus x injection)1, 30 = 4.3, p = 0.04; F(virus)1, 30 = 7.654, p = 0.009; F(injection)1, 30 = 4.263, p = 0.05. Tukey’s multiple comparison tests compared to the iD + CNO group: mC + saline, p = 0.009; iD + saline, p = 0.02; mC + CNO, p = 0.01. H. Normalized interaction times during repetitive social presentations. 7-8 mice per group. Two-way ANOVA, F(triali1-4 x virus)9,104 = 6.612, p < 0.0001; F(trial)3,104 = 28.05, p < 0.0001; F(virus)3,104 = 52.74, p < 0.0001. I. Immunohistochemistry pictures against c-fos of CRHR1-tdTomato mouse rdLS of following interaction with a familiar or novel mice. Scale bars: 50 μm. J. Percentage of CRHR1+ neurons expressing c-fos. 3 and 4 mice. 2 observations per mice. Nested t test, p = 0.007.

