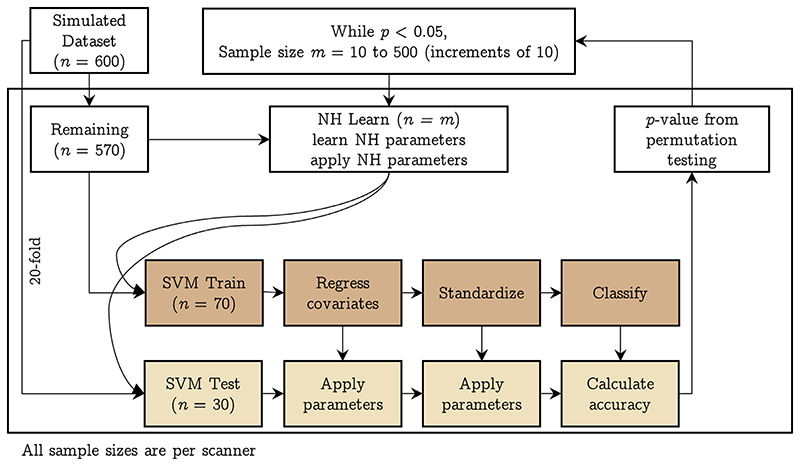
Fig. 3.
Pipeline implemented in experiment 4: using simulated data, we trained a linear SVM classifier to predict the scanner after using different samples sizes to achieve harmonization of structural features; we performed a 20-fold split on the data resulting in 30 samples per scanner (SVM Test) and 570 remaining samples per scanner. The 570 samples were next split into 500 samples per scanner (NH learn) and 70 samples per scanner (SVM Train). For every sample size 10 to 500, at increments of 10, we learnt the harmonization parameters using NH learn and applied it to SVM Train and SVM Test samples. Then, after regressing the effect of age, TIV, and sex, we standardized the SVM Train data (and applied the regression and standardization parameters to SVM Test) and trained a linear SVM classifier to predict the scanner. Model performance was assessed on SVM Test dataset. The 20-fold cross-validation was repeated 50 times and an additional 50 repeats of permutation testing (i.e., 100 repeats of permutation) were performed to assess whether the classification performance was above chance level. The whole process was repeated for every sample size in NH learn till the classification performance was above chance level. [color version of this figure is available online]. (For interpretation of the references to colour in this figure legend, the reader is referred to the web version of this article.)

