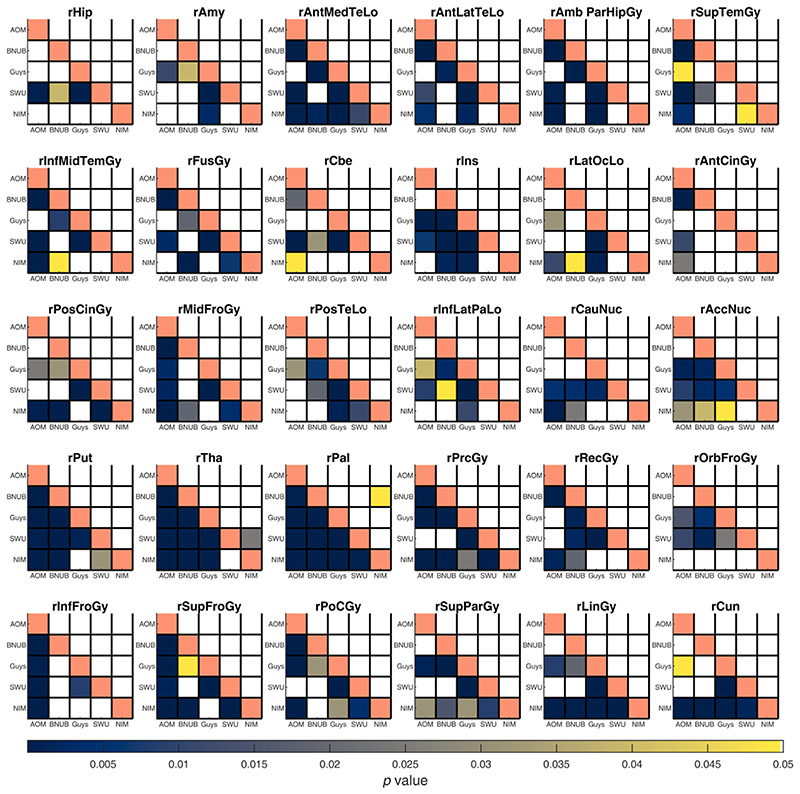
Fig. 5.
Summary of p-values from two sample Kolmogorov-Smirnov (KS) test between pairs of scanners for gray matter volumes from the right hemisphere. Each sub-plot indicates the p-values before (lower triangle) and after harmonization (upper triangle) between all pairs of scanners; the diagonal elements are shaded in a constant color to help distinguish lower and upper triangles. Each cell is color coded based on their p-value and only values smaller than 0.05 are shown. See Table S1 for the full names of the ROIs. Note that AOMIC dataset has been abbreviated to “AOM”, BNUBeijing dataset has been abbreviated to “BNUB”, and “NIMHANS” dataset has been abbreviated to “NIM”. [color version of this figure is available online].

