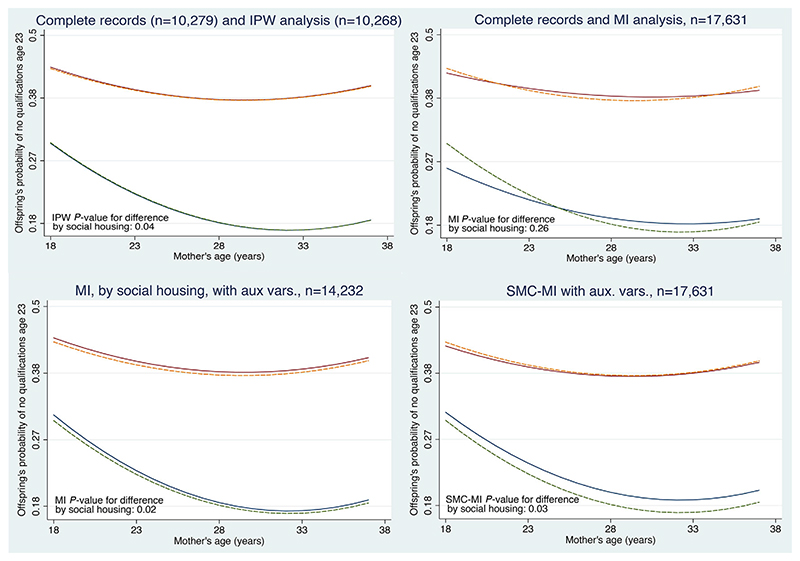
Figure 3.
NCDS data: panels show how the probability of no qualifications age 23 varies with mother’s age at birth and social housing. In each panel, for children not in care and with a birth weight of 111 ounces, the upper lines are for children who were in social housing and the lower lines for those who were not. Each panel compares the complete records analysis (dashed lines) with those from IPW (top left, largely overlaps complete records); standard MI (top right, 100 imputations); MI separately by social housing, with auxiliary variables (bottom left, 100 imputations); and substantive model compatible MI with auxiliary variables (bottom right, 100 imputations)

