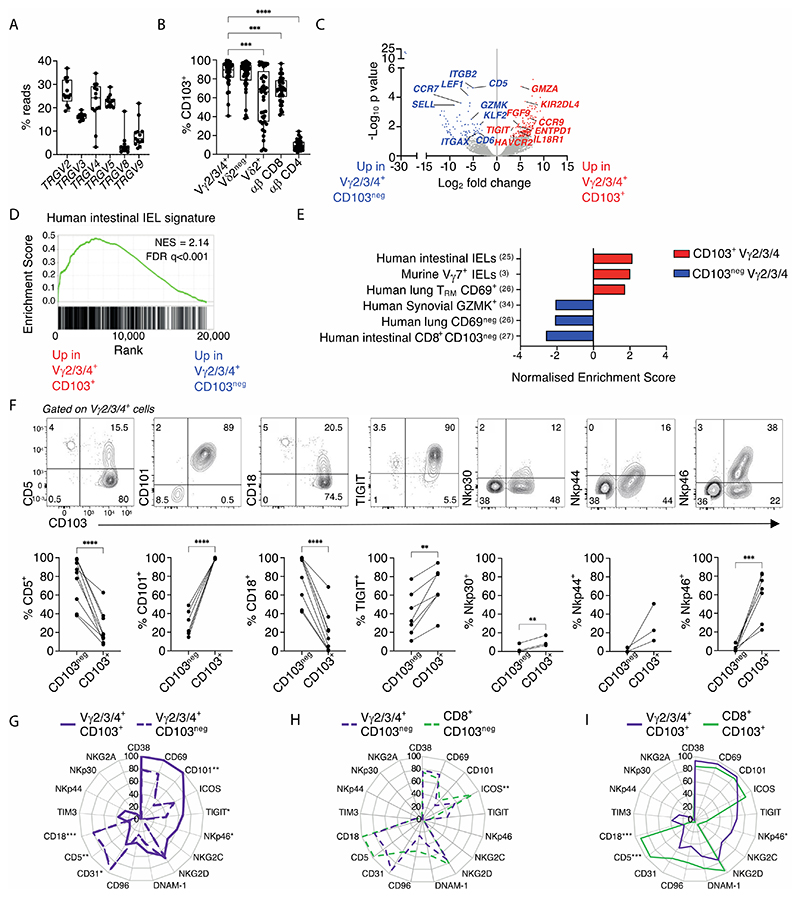
Figure 1. Human gut γδ T cells are diverse and predominantly intraepithelial cells with distinct phenotypes.
(A). TRGV gene usage in control colonic biopsies measured by mRNA TCR deep sequencing (n=13). (B) Flow cytometric analysis of CD103 expression on the indicated γδ and αβ T cell subsets. (n=38-43). Median, IQR and min-max range shown. Symbols represent individual participants. Kruskal-Wallis test with Dunn’s correction against + Vγ2/3/4+ cells was used for analysis, ***p<0.001; ****p<0.0001. (C). Volcano plot of + neg + differentially expressed genes between CD103+ and CD103neg Vγ2/3/4+ bulk sorted cells + from control donors (n=4, C36, C37, C39, C88). Red – significantly upregulated in CD103+; blue – significantly upregulated in CD103neg; grey – non-significant. Corrected for multiple comparisons (FDR<0.05). (D). Gene Set Enrichment Analysis (GSEA) of the human + + CD103 Vγ2/3/4 signature from C. in a published human natural intraepithelial lymphocyte (IEL) signature dataset (25). NES – normalized enrichment score. (E). Summary graph of GSEA for CD103+ Vγ2/3/4 (red) and CD103neg Vγ2/3/4+ (blue) gene signatures in published datasets, (FDR<0.01). (F). Flow cytometric analysis of the expression of the indicated + neg+ markers (y axis) on CD103+ and CD103neg Vγ2/3/4+ cells. Representative flow plots (top) and summary data (bottom) are shown (n=3 -9). Connected symbols represent individual participants. Paired t-tests, **p<0.01; ***p<0.001; ****p<0.0001 (G-I). Radar plot of the + + + neg cell surface phenotype of (G) Vγ2/3/4+ CD103+ versus Vγ2/3/4+ CD103neg T cells; (H) Vγ2/3/4+ CD103neg versus CD8+ CD103neg αβ T cells; (I) Vγ2/3/4+ CD103 versus+ versus CD8+ CD103+ αβ T cells. (n=3-9 individuals per group) Plotted values represent mean of included participants. Multiple paired t-tests with Bonferroni-Dunn correction, *p<0.05; **p<0.01; ***p<0.001; ****p<0.0001.+

