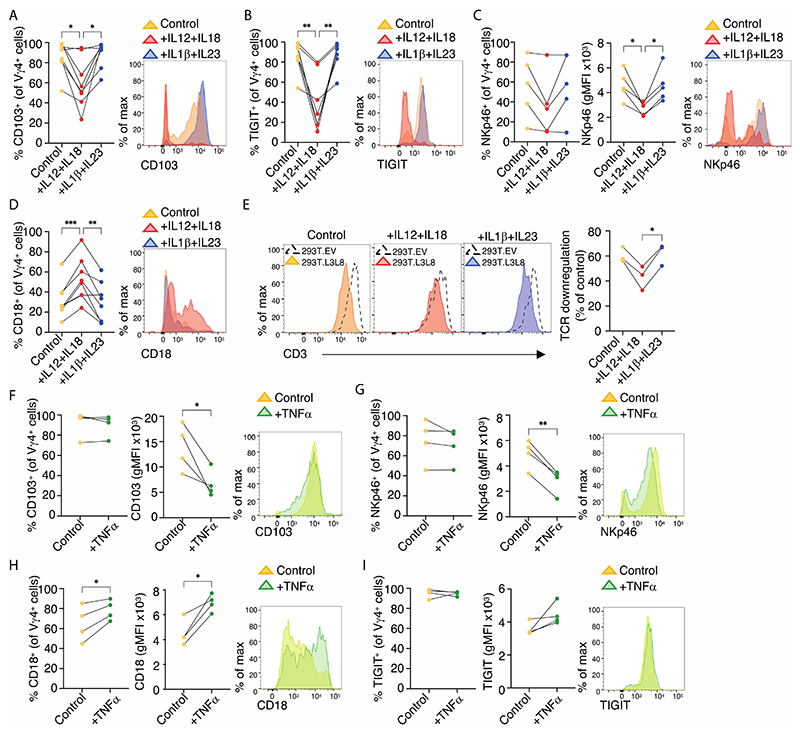
Figure 5. The cytokine milieu can affect the phenotype of intestinal Vγ4+ cells.
(A-D). Flow cytometric analysis of (A) CD103 (n=8), (B) TIGIT (n=8), (C) NKp46 (n=5), and (D) CD18 (n=8) expression on Vγ4+ colonic lymphocytes cultured for 7 days in IL2+IL15 (control); IL2+IL15+IL12+IL18 and IL2+IL15+IL1β+IL23. Summary data (left) and representative histograms (right) shown. Connected symbols represent individual participants. Repeated measures one-way ANOVA with Dunnett’s correction against IL12+IL18 treatment was used for analysis, *p<0.05; **p<0.01; ***p<0.001. (E). Flow cytometric analysis of Vγ2/3/4+ colonic lymphocytes cultured for 7 days as in A-D and subsequently co-cultured overnight with 293T.EV and 293T.L3L8 cells (n=3). Representative flow plots of CD3 expression and summary graph (far right) of percent TCR downregulation relative to 293T.EV control are shown. Repeated measures one-way ANOVA with Bonferroni correction, *p<0.05. (F-I). Flow cytometric analysis of (F) CD103, (G) NKp46, (H) CD18 + and (I) TIGIT expression on Vγ4 colonic lymphocytes cultured for 7 days in IL2+IL15 (control) and IL2+IL15+TNFα (n=4). Summary data (left, centre) and representative histograms (right) shown. gMFI - geometric mean fluorescent intensity. Connected symbols represent individual participants. Paired t-test, *p<0.05; **p<0.01.

