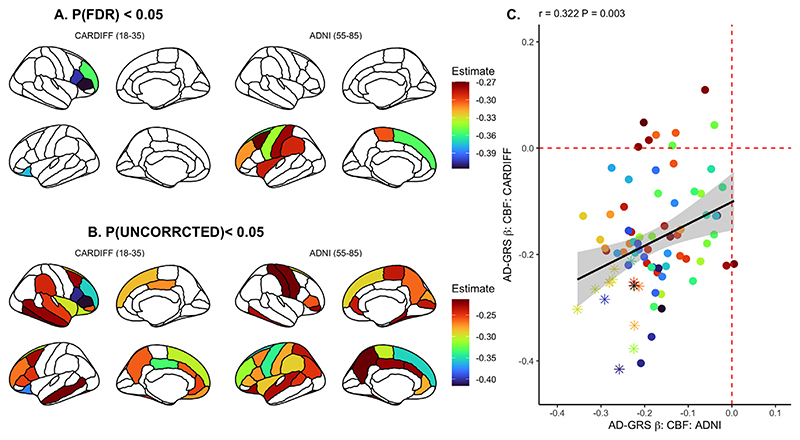
Fig. 3.
Regional association between AD-GRS and CBF in both Cardiff (Chandler et al., 2019) and ADNI samples, corrected for false discovery rate (A) (PFDR < 0.05) and uncorrected (B) (PUNCORRCECTED < 0.05). (C) Linear relationship of effect sizes (standardized beta coefficients) across the brain when comparing all cortical regions between sample B & C, where data points represented as an asterisk reflect p < 0.05 in both samples. Each point in the scatter plot represents one cortical / subcortical region. Regression slope grey area represents 95% confidence intervals.

