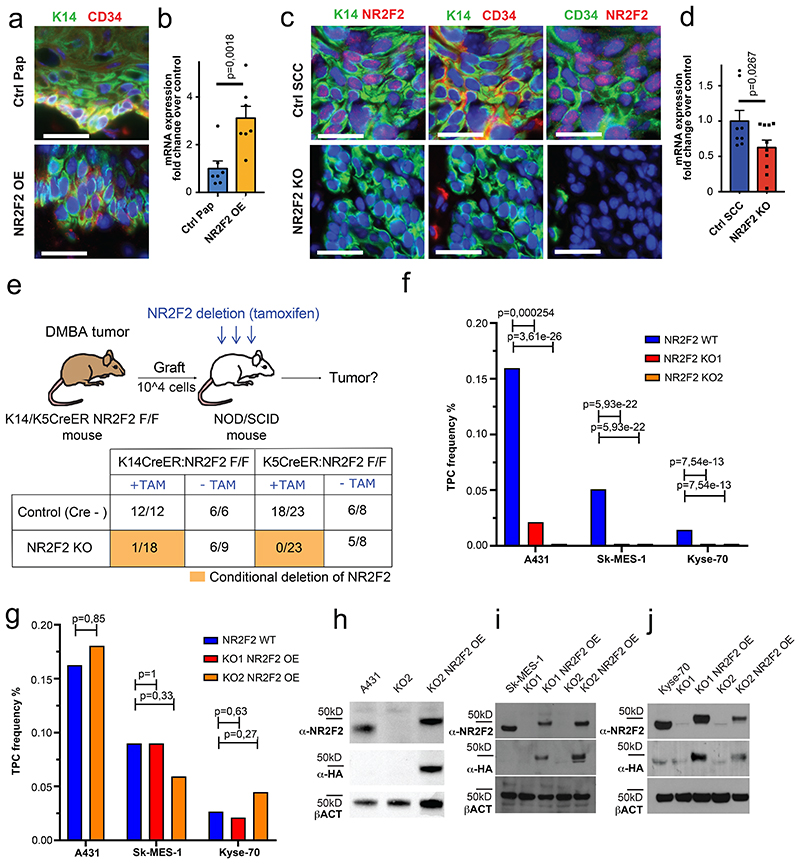
Figure 3. NR2F2 promotes tumor stemness in mouse and human SCC.
a: immunostaining for K14 (tumor cells), and CD34 (CSC marker) in control and NR2F2 gain of function papillomas showing that NR2F2 overexpression in papillomas induces CD34 expression. Representative images of at least 5 independent biological replicates each for Ctrl and NR2F2 OE. b: qRT-PCR for CD34 in tumor cells from control and NR2F2 OE papillomas. The mRNA expression is normalized to non-induced controls. (n=7 Ctrl and NR2F2 OE tumors) c: immunostaining for K14 (tumor cells), NR2F2, CD34 (CSC marker) in control and NR2F2 KO SCC, showing that NR2F2 deletion in carcinomas decreases CD34 expression. Representative images of at least 5 independent biological replicates each for Ctrl and NR2F2 KO. d: qRT-PCR for CD34 in tumor cells from control and NR2F2 KO SCC. The mRNA expression is normalized to controls. (n=8 Ctrl and 10 NR2F2 KO tumors).
e: Scheme of the experimental strategy and the proportion of secondary tumors following the transplantation of 104 WT and NR2F2 KO mouse tumor cells, expressed as fraction of growing secondary tumors/total of grafted points (n=3 primary tumors per genotype used for the FACS isolation of tumor cells for grafting; n=6-23 tumor grafts per condition as specified in the table). f: Tumor propagating cell (TPC) frequency calculated using the extreme limiting dilution analysis (ELDA) for A431 (skin SCC), SK-MES1 (lung SCC) and Kyse-70 (esophagus SCC) WT and NR2F2 KO human SCC cell lines. The graph shows the TPC calculated based on the ELDA exact value using n=3-5 mice per cell line and condition and 2 grafts per mouse. p-value is calculated using chi-square test. g: Proportion of secondary tumor formation and tumor propagating cell frequency calculated by using the extreme limiting dilution analysis (ELDA) for A431, SK-MES-1 and Kyse-70 parental SCC cell lines and NR2F2 KO rescue clones carrying the NR2F2-3HA transgene (NR2F2 OE). p-value is calculated using chi-square test. The graph shows the TPC calculated based on the ELDA exact value using n=3-5 mice per cell line and condition and 2 grafts per mouse. h: WB for NR2F2, HA tag and actin in parental A431 cells, NR2F2 KO or NR2F2 rescue by OE. i: WB for NR2F2, HA tag and actin in parental SK-MES1 cells, NR2F2 KO or NR2F2 rescue by OE. j: WB for NR2F2, HA tag and actin in parental Kyse-70 cells, NR2F2 KO or NR2F2 rescue by OE. Scale bar in a and c=50μm. Data in b and d are represented as mean ± SEM. The p-values in b and d are calculated using the one-tailed t-test. WB are representative of two independent experiments with similar results in h, and three independent experiments with similar results in i and j.

