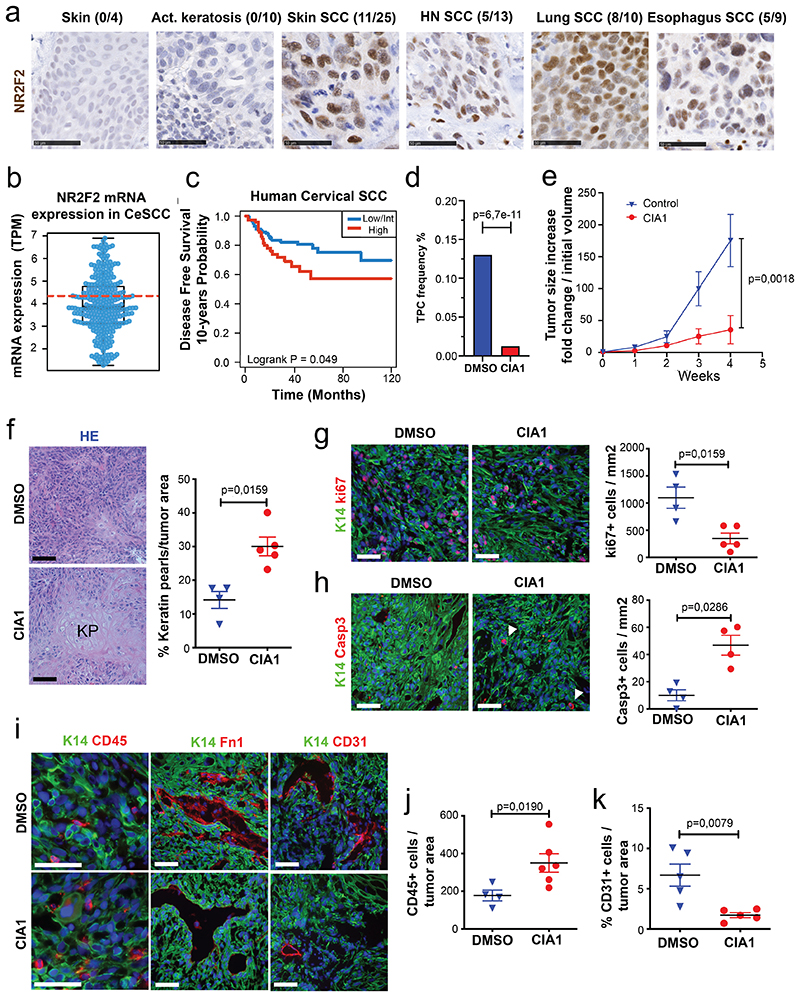
Figure 7. Targeting NR2F2 function in human SCCs.
a: IHC for NR2F2 in human skin, benign lesions (actinic keratosis) and various SCC types. Above each panel the fraction of positive samples is indicated. Scale bar= 50μm. Representative images from independent replicates as indicated above each panel (n= 4 skin, 10 act.keratosis, 25 skin SCC, 13 HN SCC, 10 lung SCC and 9 esophagus SCC).
b: Box plot of NR2F2 mRNA expression measured in Transcript Per Million in biopsies of human Cervical SCC. Boundaries of the box indicate the first and third quartiles of the NR2F2 mRNA expression value. The bold black horizontal line indicates the median and the two external horizontal black lines shows the minimum and maximum values. The bold dotted red line represents the top-tertile. The dots represent all data points. N=304 biologically independent samples.
c: Disease-free survival (DFS) of patients with Cervical SCC stratified by the level of NR2F2 expression (Top-tertile cut-point) (p=Log-Rank-Mantel-Cox test). N=304 biologically independent samples described in panel b.
d, e: Targeting NR2F2 with small molecule inhibitor in human SCC. d: Tumor propagating cell frequency calculated by using the extreme limiting dilution analysis (ELDA) of human skin A431 cells following CIA1 treatment. p-value is calculated using chi-square test. The graph shows the TPC calculated based on the ELDA exact value using per condition n=4-6 mice for the DMSO treatment and n=5-6 mice for the CIA1 treatment and 2 grafts per mouse. e: Increase in grafted A431 tumor volume compared to initial volume at the beginning of CIA1 treatment. p-value is calculated using mixed effect Anova (n=7 tumors for DMSO control, 10 for CIA1 treatment).
f-k: Histology of CIA1 treated xenograft tumors. f: HE of control and CIA1 treated tumors displaying increased presence of keratin pearls (KP) and quantification of KP per tumor area (n=4 DMSO control and 5 CIA1 treated tumors). g: Immunostaining (left) for Ki67 (proliferating cells) and K14 (Tumor cells) and quantification (right) of Ki67+ cells/mm2 (n=4 Ctrl and 5 CIA1 treated tumors). h: Immunostaining (left) for cleaved Caspase 3 (apoptotic cells, arrowheads) and K14 (Tumor cells) and quantification (right) of Casp3+ cells/mm2 (n=4 Ctrl and 5 CIA1 treated tumors). i: Immunostaining of control and CIA1 treated tumors for K14 (tumor cells) and CD45 (immune cells), Fibronectin-1 and CD31 (endothelial cells). j: quantification of CD45+ cells/tumor area (n=4 Ctrl and 6 CIA1 treated tumors). k: quantification of the percentage of CD31+ cells/tumor area (n=5 Ctrl and 5 CIA1 treated tumors). All images are representative of minimum 4 independent biological replicates each per condition.
Scale bar = 50μm. Data are represented as mean ± SEM. The p-value is calculated using a two-tailed Mann-Whitney test.

