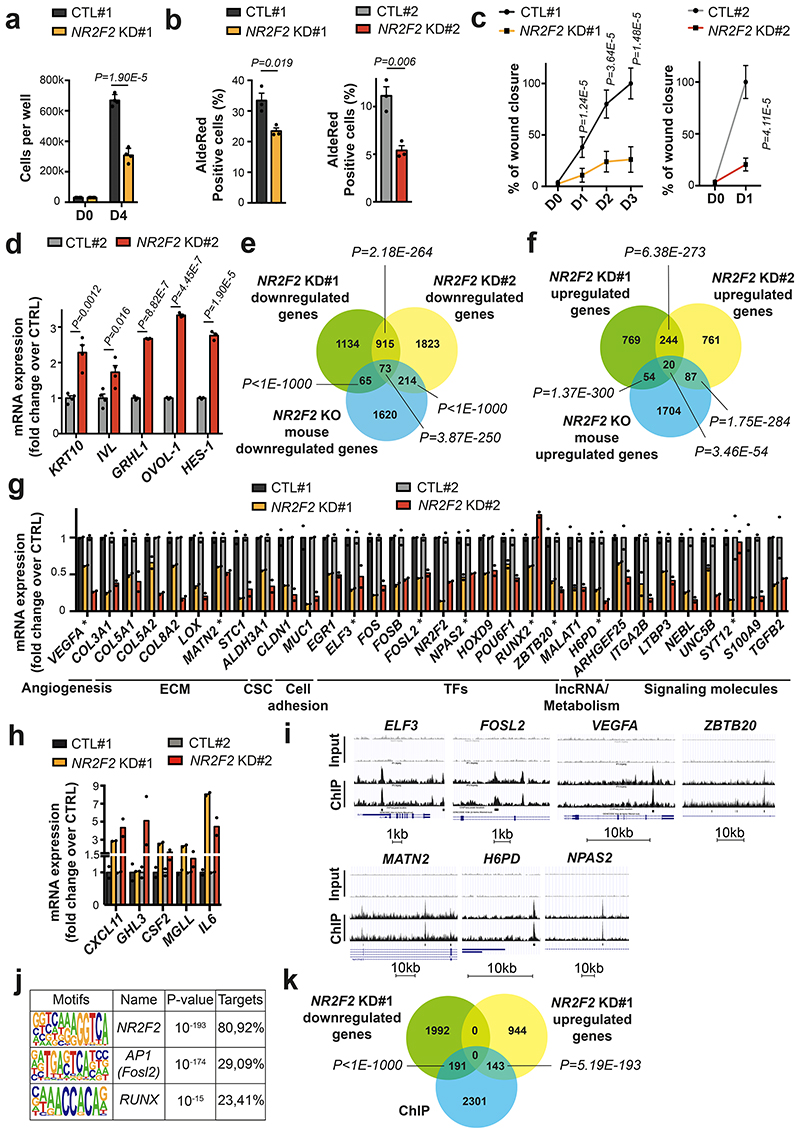
Figure 8. Conservation of NR2F2 function in human SCCs.
a: Quantification of cell number in A431 control and NR2F2 shRNA KD#1 (n=4 biological replicates).
b: ALDH activity in A431 control and NR2F2 shRNA KD #1 and #2 cell lines. (n=3 biological replicates).
c: Wound healing assay in A431 control and NR2F2 shRNA KD #1 and #2 cell lines (n=3 biological replicates, 3-4 pictures per well).
d: mRNA (qPCR) expression of differentiation genes in calcium switch induced A431 cells control and NR2F2 shRNA KD (n=4 for KRT10 and IVL, n=3 for GRHL1, OVOL-1, HES-1).
e, f: Venn diagram of the genes downregulated (e) and upregulated (f) upon NR2F2 KD in human SCC cell lines (A431 control and NR2F2 shRNA KD #1 and #2 cell lines) and in NR2F2 KO mouse SCC. (p-values are calculated using Two-sided hypergeometric test).
g, h: mRNA expression (RNA-seq) of downregulated (g) and upregulated (h) genes following NR2F2 KD in human SCC cell lines. ECM, extracellular matrix; CSC, cancer stem cells; TF, transcription factor; IncRNA, long-noncoding RNA. ChIP-identified NR2F2 direct targets were highlighted using (*) label (n=2 biological replicates).
i: A431 NR2F2 ChIP-seq profiles at selected gene loci, including Input on top. j: Transcription factor motifs enriched in the ChIP-seq for NR2F2 peaks that were enriched in A431 cells overexpressing NR2F2 compared to input as determined by Homer analysis using known motif search.
k: Overlap of the A431 NR2F2 ChIP-seq peaks with the downregulated and upregulated genes in the NR2F2-knockdown #1 human cell line (p-values are calculated using Two-sided hypergeometric test).
Data in a, b, c, d, g, h are represented as mean ± SEM. The p-values are calculated using the Mann-Whitney test in c, two-tailed t-test in the other cases.

