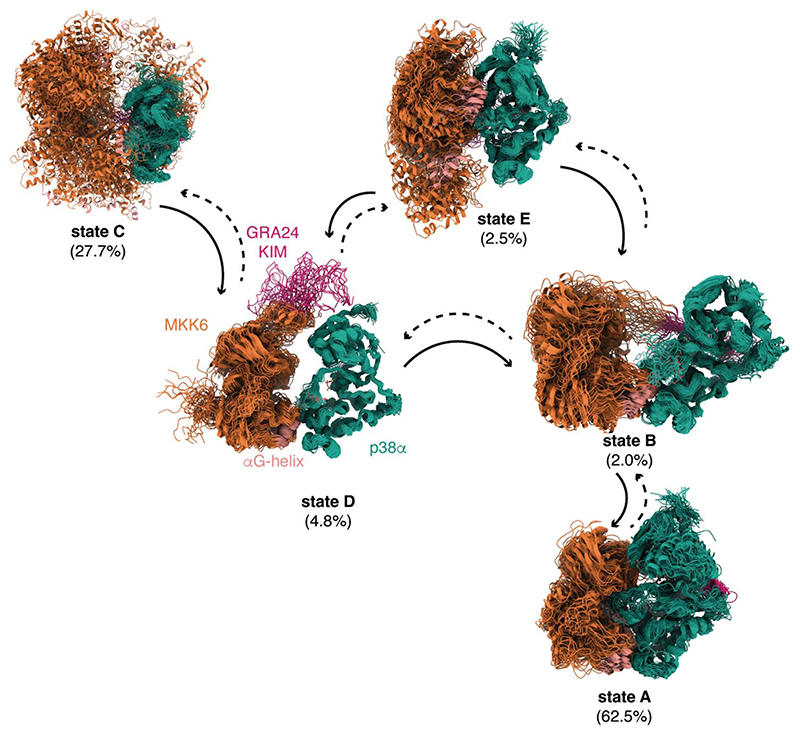
Fig. 4. Kinetic-based clustering of the accumulated simulations of MKK6GRA-p38α.
Each macrostate shows an overlay of 50 representative conformations sampled proportionally to the equilibrium probability of each microstate in the corresponding macrostate that correlates to different kinetically distinct states. The population of each state as derived from the fitting to the MKK6DDGRA + p38αWT + ADP + AlF4- SAXS curve (fig. S2) is given in parenthesis. The solid arrows indicate the main directions of the observed reactive trajectories connecting the macrostates.

