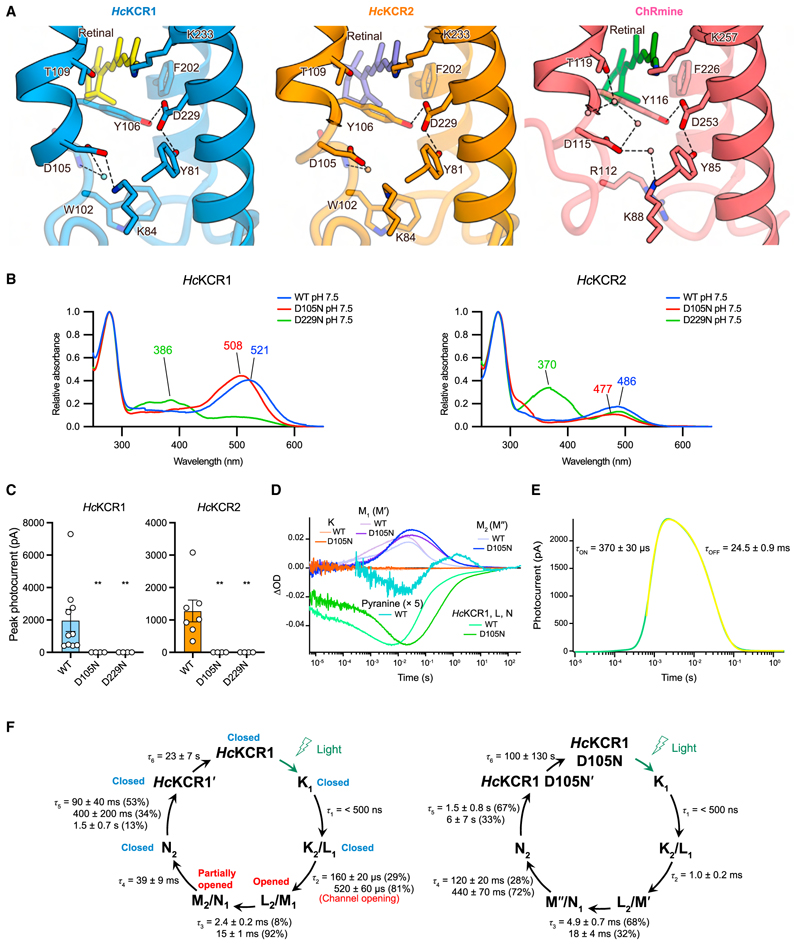
Figure 2. The Schiff base region.
(A) Schiff base regions of HcKCR1 (left), HcKCR2 (middle), and ChRmine (right). Water molecules are represented by spheres. Black dashes indicate H-bonds.
(B) Absorption spectra of HcKCR1 (left) and HcKCR2 (right) at pH 7.5.
(C) Photocurrentamplitudes of WT, D105N, and D229N of HcKCR1 (left) and HcKCR2 (right), respectively. Mean ± s.e.m. (n = 4–10; **p < 0.01; Kruskal-Wallistest with Dunnett’s test).
(D) Time-series traces of absorption change for HcKCR1 WT and D105N mutant.
(E) Transient photocurrent changes of HcKCR1 induced by pulsed laser, with raw trace (green) and fitting curve (yellow) indicated.
(F) Photocycles of HcKCR1 WT (left) and D105N (right) determined in (D).

