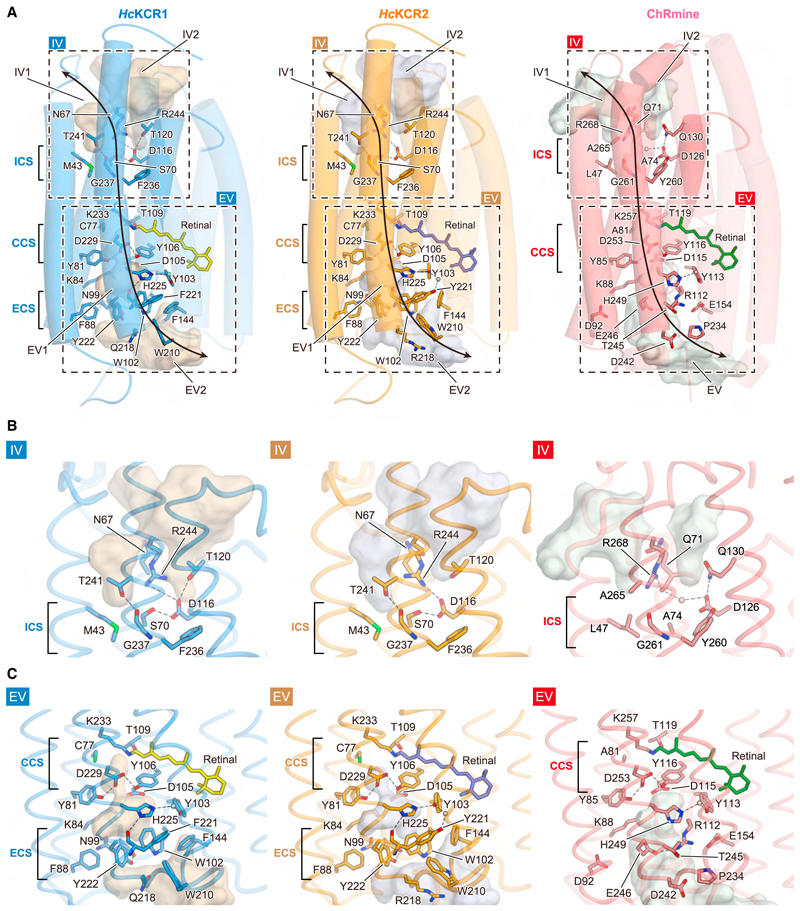
Figure 4. Ion-conducting cavities.
(A) Comparison of ion-conducting cavities among HcKCR1 (left), HcKCR2 (middle), and ChRmine (right). TMs 4–6 are displayed with higher transparency. Residues located along the cavities are shown in stick form. Black dashed rectangles indicate IV and EV regions highlighted in (B) and (C), respectively. Black arrows represent the putative ion-conducting pathway.
(B and C) IV (B) and EV (C) of HcKCR1 (left), HcKCR2 (middle), and ChRmine (right). Cavities are calculated with HOLLOW, and black dashes indicate H-bonds. Locations of ICS, CCS, and ECS are indicated on the left in each panel.

