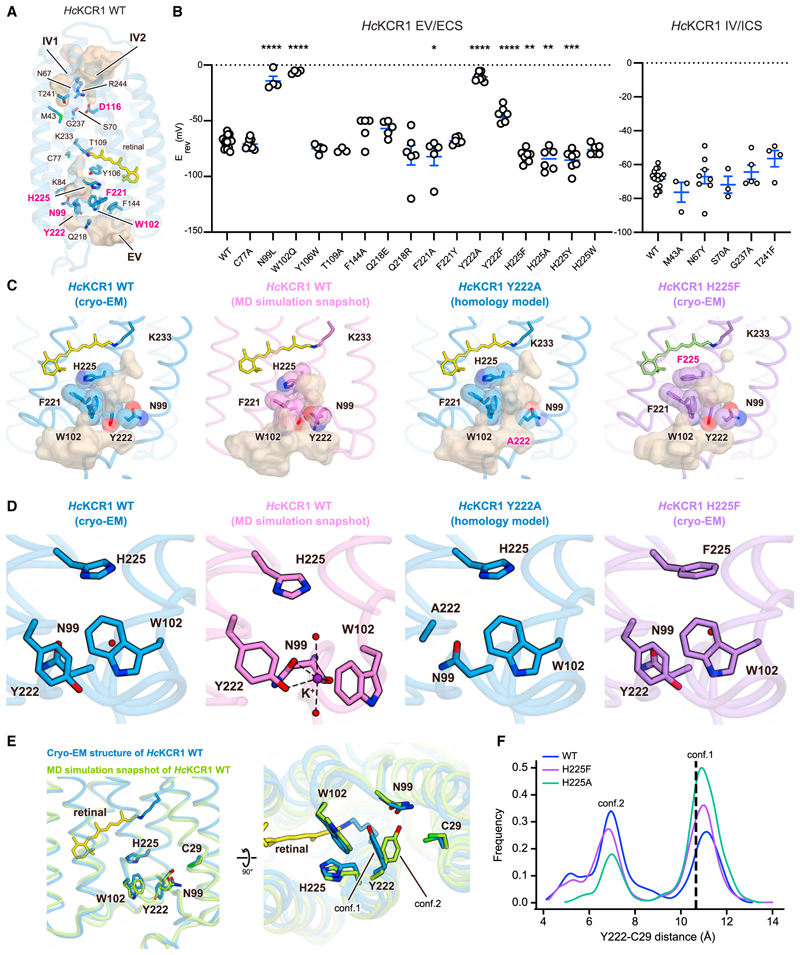
Figure 5. K+-selectivity filter.
(A) Residues along ion-conducting cavities in HcKCR1 WT. Erev-affecting mutations are in magenta.
(B) Erev summary for mutations highlighted in (A). Mean ± s.e.m. (n = 3-17; one-wayANOVAwith Dunnett’stest; *p < 0.05, **p < 0.01, ***p < 0.001, ****p < 0.0001).
(C and D) Selectivity filter region of HcKCR1 WT (cryo-EM structure), K+-coordinated form of HcKCR1 WT (MD snapshot), Y222A mutant (homology model), and H225F mutant (cryo-EM structure), viewed parallel to membrane (C) and magnified (D). Cavities calculated with HOLLOW. Black dashes indicate H-bonds; purple and red spheres indicate K+ and water, respectively.
(E) Superimposed HcKCR1 WT structure (blue) and MD snapshot (green) viewed parallel to membrane (left) and from extracellular side (right). Residues in the filter and retinal are shown as sticks.
(F) Histograms of distances between Y222 and C29 during simulations.

