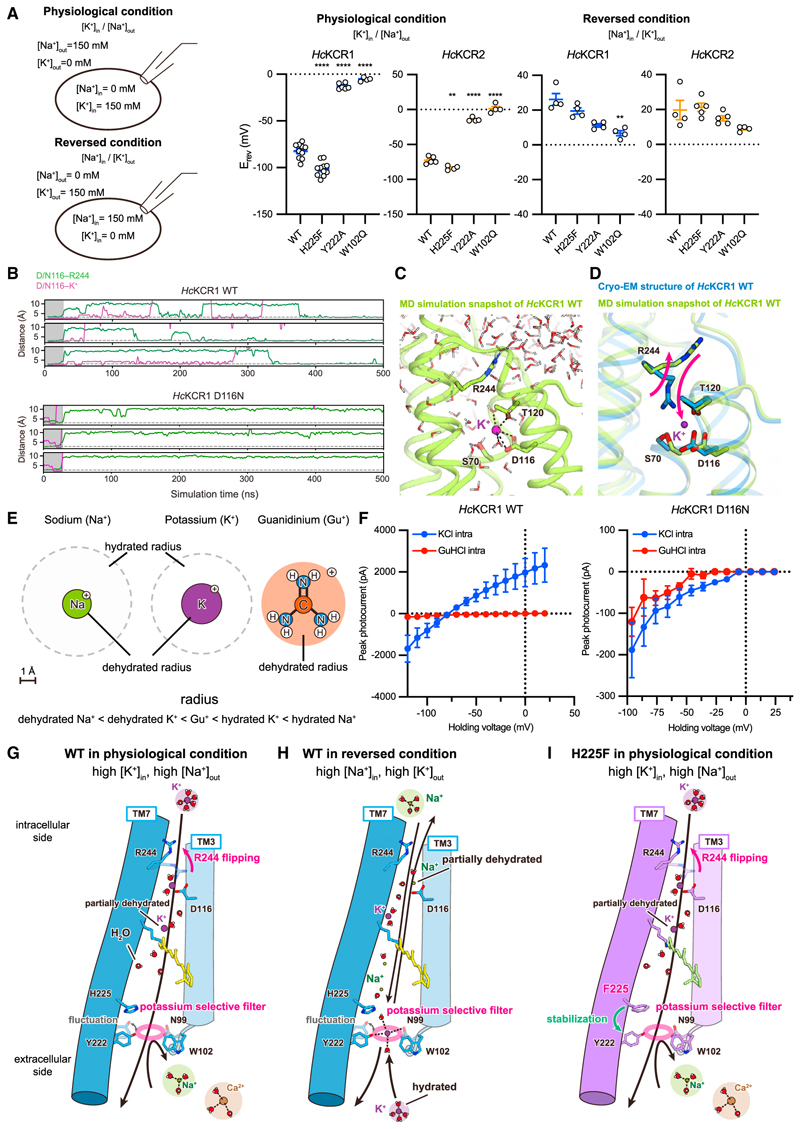
Figure 6. Computational and functional analyses of permeant ion dehydration.
(A) Schematics (left) and Erev for WT and three mutantsof HcKCR1 and HcKCR2 under physiological (middle) or reversed (right) conditions. Mean ± s.e.m. (n = 4–21; one-way ANOVA with Dunnett’s test; **p < 0.01, ****p < 0.0001).
(B) Representative traces from MD simulation of HcKCR1 WT (top) and D116N (bottom).
(C) MD snapshot showing transient binding of partially dehydrated K+.
(D) Superimposed HcKCR1 structure and MD snapshot.
(E) Ionic and hydration radii of cations.
(F) Current-voltage (I-V) relationships of HcKCR1 WT (left) and D116N (right) with and without GuHCl. Mean ± s.e.m. (n = 3–8).
(G–I) Ion conduction models of WT HcKCR in physiological (G) and reversed conditions (H), and H225F in physiological conditions (I). TMs 1, 2, and 4–6 are removed forclarity. Black arrow and dashed lines indicate cation flow and H-bonds, respectively. Oxygen and hydrogen atoms ofwater molecules are shown as spheres colored in red and white, respectively. Magenta circles represent K+-selective filters.

