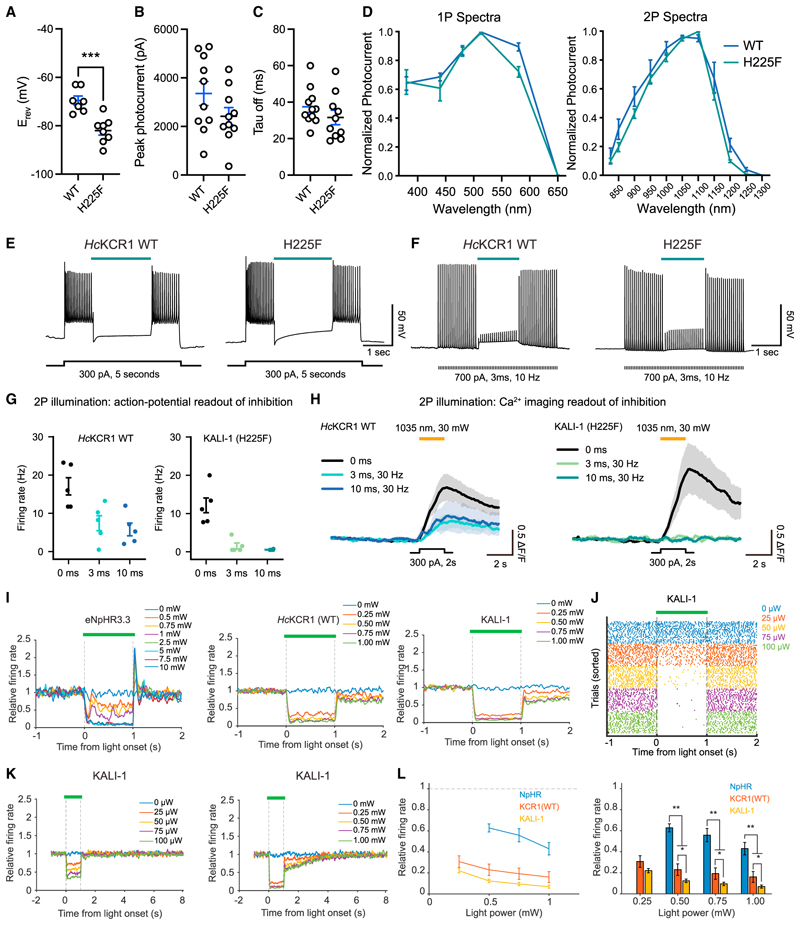
Figure 7. In vitro and in vivo applications of KALI-1.
(A–C) Summary of reversal potential (A), peak photocurrent (B), and deactivation kinetics (C) (mean ± s.e.m.; n = 7–8; two-tailed t test; ***p < 0.001).
(D) Summary of action spectra for WT and H225F variant under 1P (left) and 2P (right) illumination (mean ± s.e.m.; n = 5–6).
(E and F) Optogenetic inhibition in brain slices stimulated by tonic (E) or phasic (F) currents.
(G) Summary plots of optogenetic inhibition for different 2P durations in cultured neurons (mean ± s.e.m.; n = 5).
(H) Representative Ca2+ transients during optogenetic inhibition with different 2P illumination durations in neurons (mean ± s.e.m.; n = 5).
(I) Neuropixels in mouse retrosplenial cortex (RSP). Data represent n = single units: 19 for eNpHR3.3 (left), 78 for WT (middle), and 241 for KALI-1 (right).
(J) Spike rasters for exemplar single units inhibited by KALI-1 in moderate/low power.
(K) Relative firing rate ofthe inhibited neuronal population in KALI-1 mice in low (left) and high (right) power. Datafrom 102 unitsfor moderate/low powerand 139 for high power.
(L) Summary of eNpHR3.3,WT, and KALI-1 data in (I) represented as both line (left) and bargraphs(right). Mean ± s.e.m. acrosssingle units(bootstrap); two-tailed ttest; *p < 0.05, **p < 0.01.

