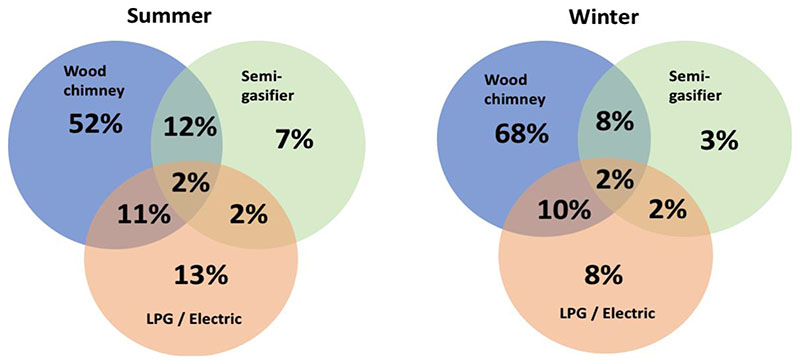
Figure 1.
Proportion of household-days in each fuel-stove-use category in summer (250 household-days in 139 homes) and winter (194 household-days in 109 homes). The overlapping areas of circles represent mixed stove-use. Household-days when at least 85% of stove-use minutes were from a single fuel-stove type were assigned to an exclusive use category.

