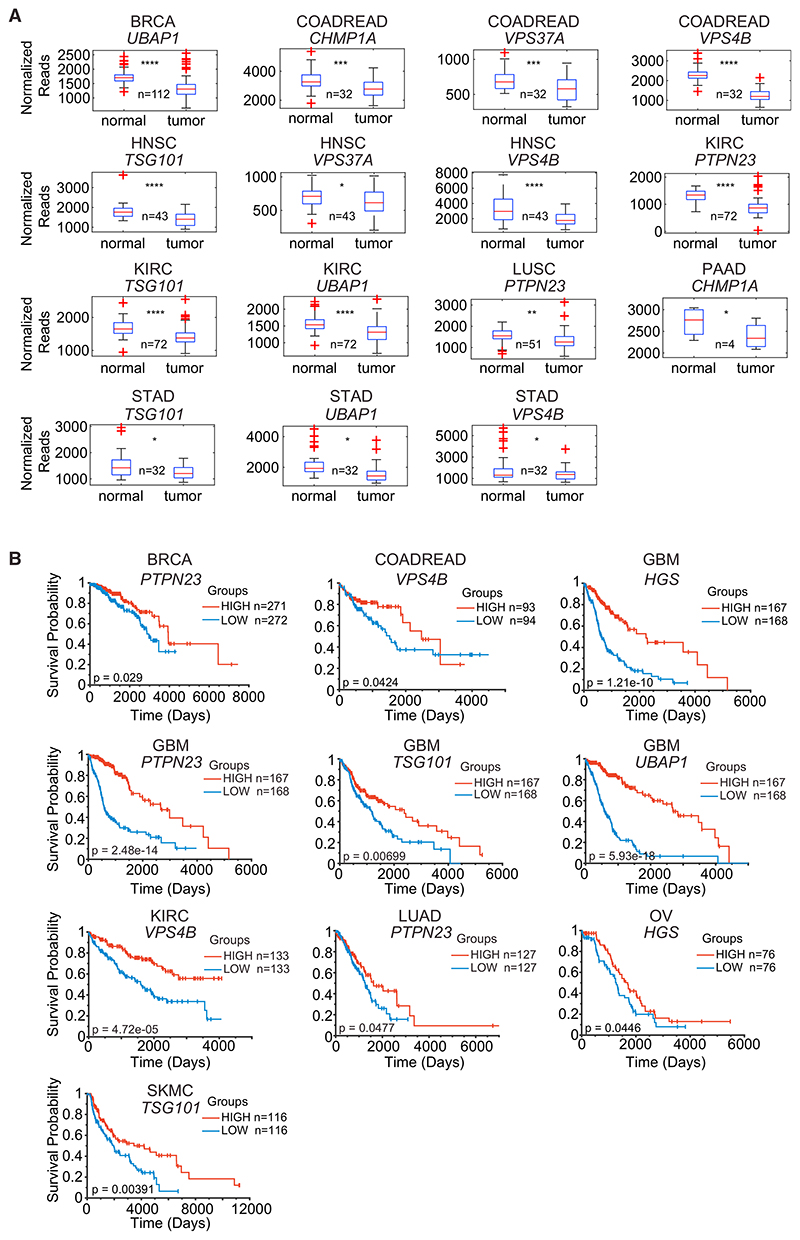
Figure 7. Reduced Expression of ESCRT Components in Tumors Correlates with Poorer Prognosis.
(A) RSEM-normalized TCGA RNA-seq expression datasets were analyzed for expression of ESCRT components in matched tumor and normal samples. Box and whisker plots are shown, where the central line indicates the sample median, box edges represent quartiles, and whiskers extend to the most extreme data points not considered outliers. Outliers are indicated with red crosses. *p < 0.05, **p < 0.005, ***p < 0.0005, ****p < 0.00005.
(B) RSEM-normalized TCGA RNA-seq expression datasets were analyzed for expression of ESCRT components. The top and bottom quantile expression ranked values for selected genes were plotted as Kaplan-Meier curves. p values are shown.
BRCA, breast invasive carcinoma; COADREAD, colorectal adenocarcinoma; GBM, glioblastoma multiforme; HNSC, head and neck squamous cell carcinoma; KIRC, kidney renal clear cell carcinoma; LUAD, lung adenocarcinoma; LUSC, lung squamous cell carcinoma; OV, ovarian serous cystadenocarcinoma; PAAD, pancreatic adenocarcinoma; SKCM, skin cutaneous melanoma; STAD, stomach adenocarcinoma.

