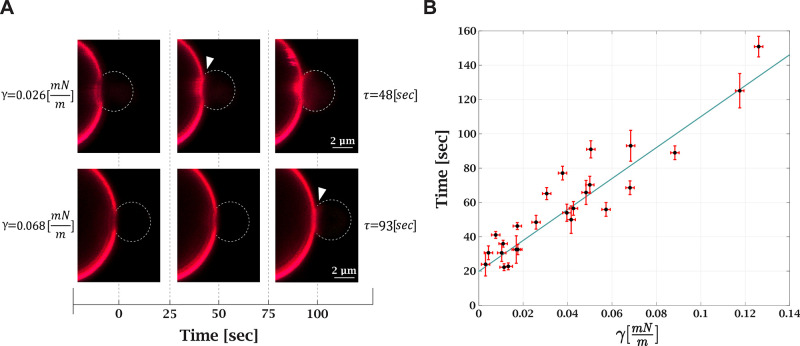
Figure 3.
Membrane tension increases lipid mixing time delay. (A) Confocal fluorescence microscopy images of lipid mixing under different tensions. The same GUV was used in both measurements. The first frame is the contact between the bead and GUV; the white arrow points to the frame with the lipid mixing initiation. Higher tension (bottom images) increases the lipid mixing time delay. (B) Lipid mixing time delay as a function of tension (25 measurements, 12 GUVs in 8 independent experiments; for 10 GUVs, multiple measurements were performed). Black dots are the experimental results, and the solid blue line is a linear trend with a 903 ± 142 m·s/mN slope.

