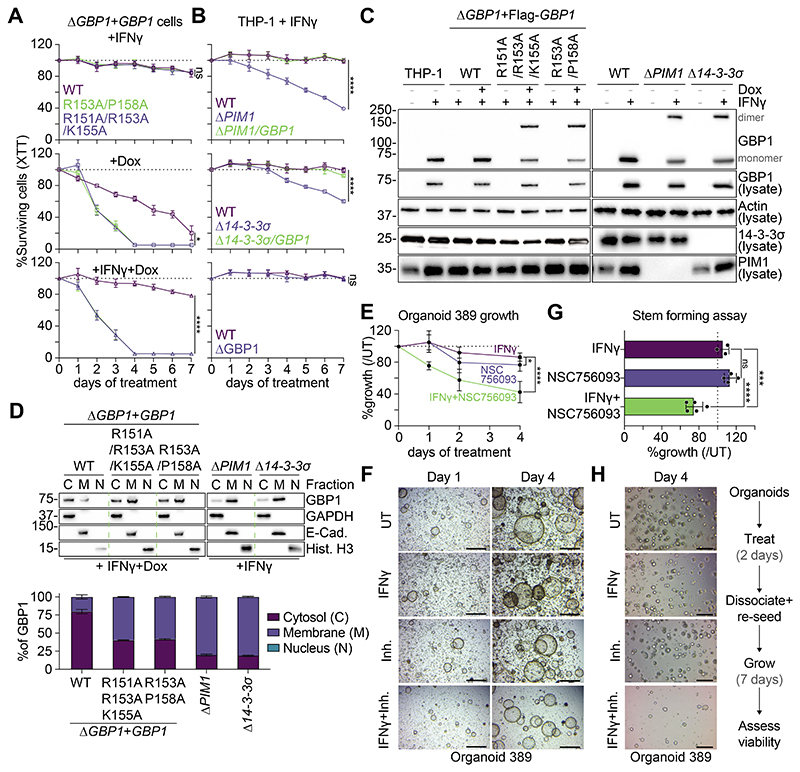
Fig. 4. PIM1 phosphorylation of GBP1 protects cells from self-inflicted damage.
(A) XTT cell survival assay of THP-1ΔGBP1+GBP1 WT, +GBP1R151A/R153A/K155A (kinase motif mutant) or +GBP1R153A/P158A (14-3-3 binding motif mutant) cells treated with IFNγ±Dox for indicated number of days. (B) XTT cell survival assay kinetics of THP-1ΔGBP1, ΔPIM1, Δ14-3-3σ, ΔPIM1/GBP1 or Δ14-3-3σ/GBP1 cells treated with IFNγ for indicated number of days. (C) Immunoblot-analysis of GBP1 in crosslinked pellets and in cell lysates of indicated cells treated with IFNγ±Dox or left untreated. (D) Immunoblots of subcellular fractionation to determine GBP1 localization in indicated cells with respective markers for the cytosol (C), membranes (M) or the nucleus (N) and quantification of localization. (E) MTT survival assay of patient-derived colorectal tumour organoids treated with IFNγ and NSC756093 for 4 days, shown as percent growth compared to non-treated controls. (F) Images of organoids following indicated treatments with IFNγ and inhibitor NSC756093 (Inh.). Scale bar 1 mm. (G) Stem forming assay of organoids treated for 2 days as indicated, dissociated, and re-grown for 7 days in the absence of treatment. MTT assay on day 7 following re-seeding indicating relative re-growth. (H) Representative images from day 4 of re-growth of stem forming assay. Scale bar 200 μm. Data information: Images in (C-D) and (F-H) representative of n = 3 experiments. Graphs in (A-B), (D-E) and (G) show mean ± SEM n = 3 experiments, normalized to untreated cells. * P ≤0.05; *** P ≤ 0.001; **** P ≤ 0.0001 in (A-B), (E) and (G) comparing to WT or untreated (UT) cells and for indicated comparisons in (E) from one-way ANOVA and in. For gel source data, see Data S5.

