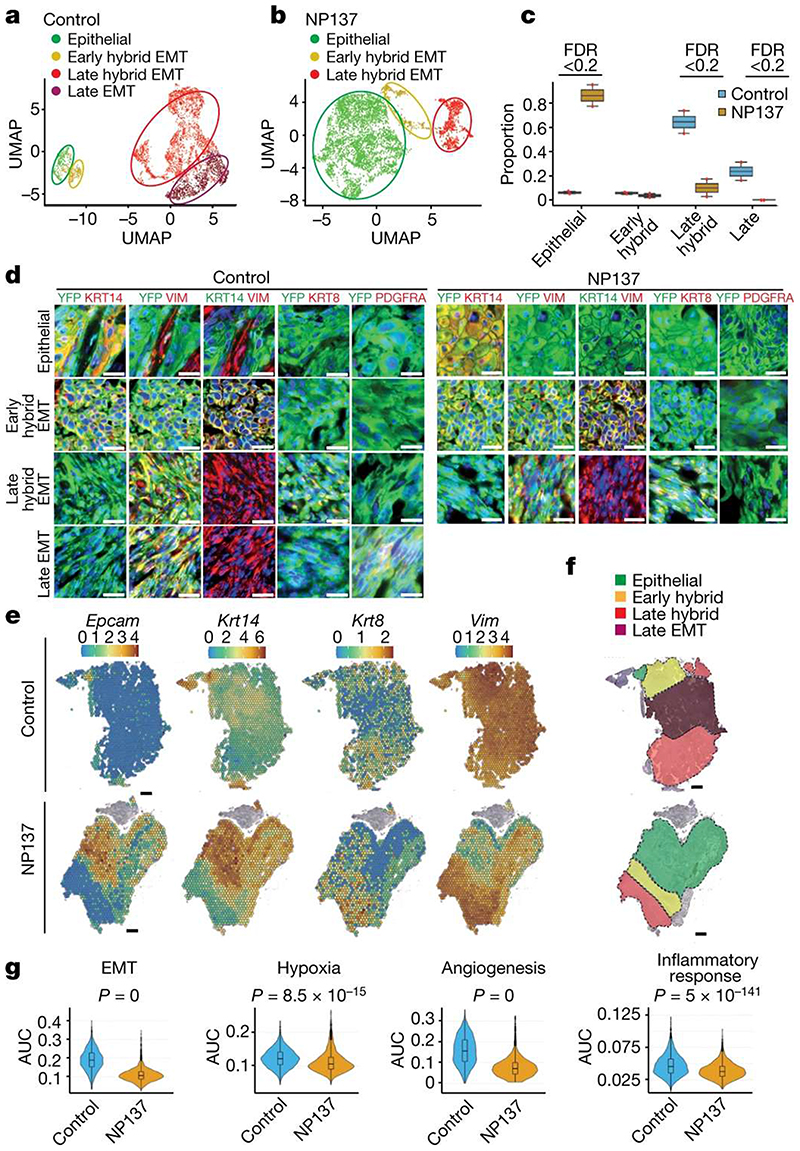
Figure 3. Pharmacological inhibition of netrin-1 inhibits late EMT and promotes epithelial tumour states.
a,b, Uniform manifold approximation and projection (UMAP) plots coloured by EMT state for control (a) and NP137-treated (b) YFP+ tumour cells from skin SCC. Colours represent the different tumour states. c, Box plot depicting the proportion of tumour states for the four samples in control and NP137-treated conditions. Significant changes in proportion are defined as false discovery rate (FDR) <0.2. d, Co-immunostaining of YFP and KRT14, KRT8, vimentin and PDGFRA in control (left) and anti-netrin-1 treated (right) skin SCC from LKPR mice, defining areas with different degrees of EMT (n = 3 control tumours and n = 3 NP137-treated tumours). Scale bars, 20 m. e, Spatial transcriptomics using 10x Visium was conducted on tumour sections of control and NP137-treated mice. Normalized gene expression values are represented as a colour gradient. f, Summary of the different areas presenting different tumour states based on the expression of Epcam, Krt14, Krt8 and Vim: epithelial, Epcam+ Krt14+ Vim- ; early hybrid EMT, Epcam-Krt14+ Vim+ ; late hybrid EMT,Epcam− Krt14−Krt8+Vim+; late full EMT, Epcam− Krt14−Krt8− Vim+. g, Combined box plot and violin plot showing the activity of 4 MSigDB38 hallmark gene sets (epithelial-to-mesenchymal transition, hypoxia, angiogenesis and inflammatory response) in control (n = 2) and NP137-treated (n = 2) tumours. The area under the curve (AUC) indicates enrichment of the different hallmark gene sets in NP137-treated tumours relative to control tumours. Twosided Wilcoxon rank-sum test with Bonferroni correction. In box plots, the centre line represents median, box edges delineate 25th and 75th percentiles and whiskers extend to 1.5 times the interquartile range (IQR).

