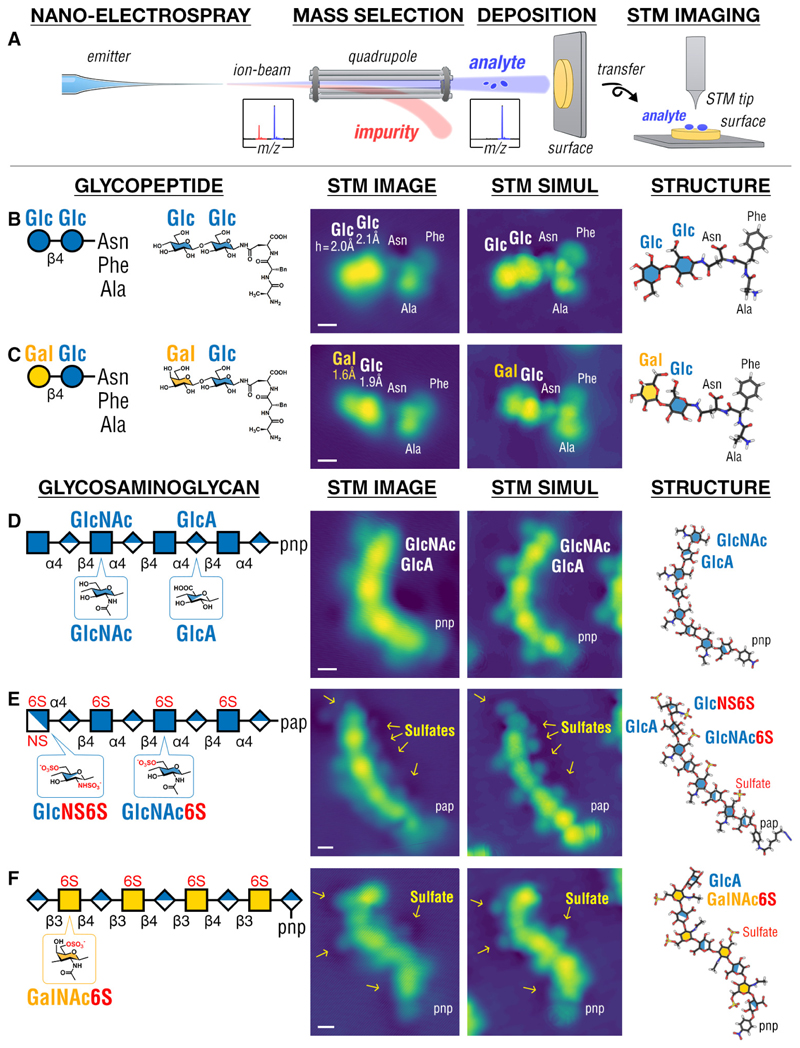
Fig. 1. STM imaging of simple glycoconjugates and glycosaminoglycans (GAGs).
(A) Schematic of the experiment: glycoconjugate or GAG ions generated by nESI were mass-selected, soft-landed intact on surface held at 120 K, and imaged by STM at 11 K (see Methods). STM images of glycopeptides, Glc-Glc-AsnPheAla (B) and Gal-Glc-AsnPheAla (C), reveal the glycan and the peptide domains of the molecule and differentiate each monosaccharide in the glycan domain i.e. glucose (Glc) vs galactose (Gal). Imaging GAGs (D-F) reveals the positions of N-Acetyl groups on all N-acetylglucosamine (GlcNAc) monosaccharides, differentiating them from the glucuronic acid (GlcA) monosaccharides as well as the sulfated GlcNAc6S, GalNAc6S, and GlcNS6S monosaccharides. The GAGs in (D) and (F) are terminated by para-nitrophenyl (pnp), while in (E) the GAG is terminated by para-(6-azidohexanamido)phenyl (pap). STM images were interpreted by STM simulation of molecular structures computed by DFT. Scale bar is 0.5 nm. Glycan icons follow the SNFG standard (56).

