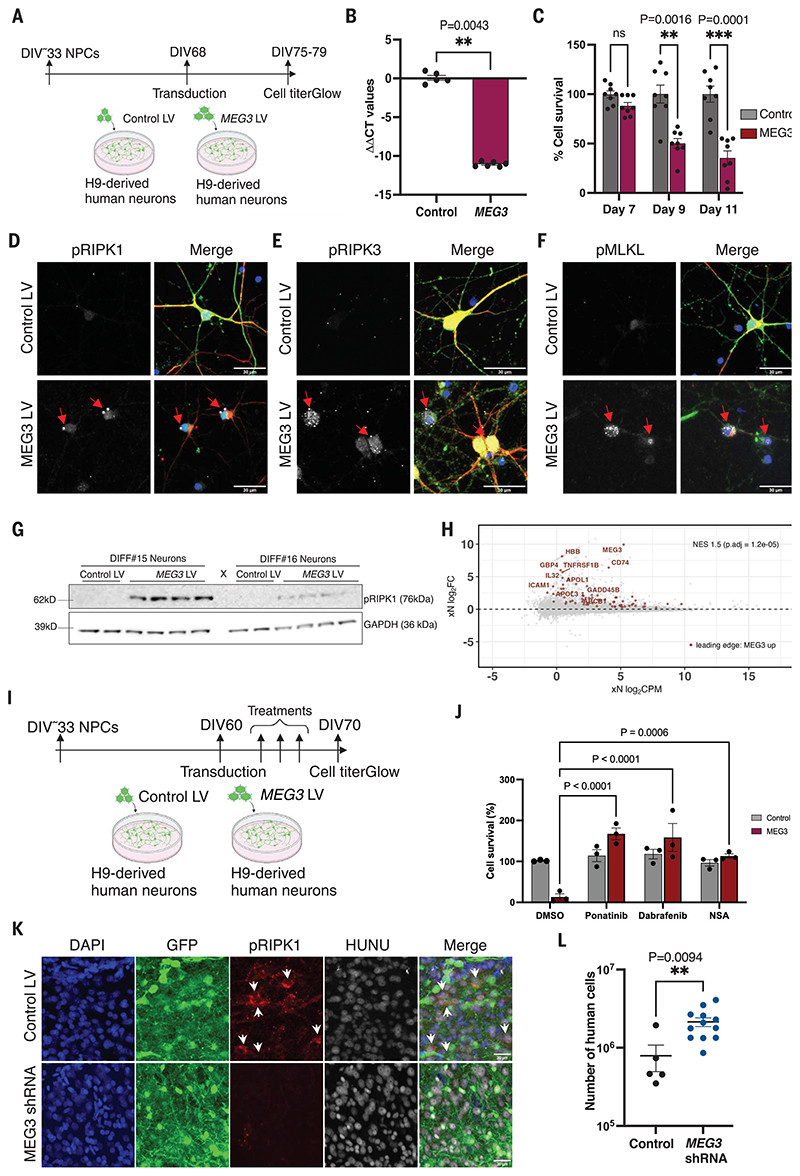
Fig. 3. Long noncoding RNA MEG3 induces necroptosis in human neurons.
(A) Schematic representation of the MEG3 expression strategy using lentiviral vectors (LV) in H9-derived human neurons. (B) Analysis of the MEG3 expression 7 days after transduction with control LV (n = 5) or MEG3 LV (n = 6) in DIV75 neurons. (C) Analysis of neuronal cell survival using Cell-Titer-Glo reagent after transducing with either control LV (n = 8) or MEG3 LV (n = 8). (D) Confocal images showing pRIPK1 (Ser166), (E) pRIPK3 (Ser227), (F) pMLKL (Ser358) in neurons at DIV75 and 7 days after transduction with control LV (n = 3) or MEG3 LV (n = 3). Scale bars: 30 μm. (G) Immunoblot analysis of pRIPK1 (Ser166) levels 7 days after transduction (DIV75) with control LV (n = 4) or MEG3 LV (n = 8). Glyceraldehyde phosphate dehydrogenase (GAPDH) is the loading control. Two independent differentiations were analyzed. (H) Same Bland-Altman MA plot showing differential expression of bulk RNA sequencing of human grafts from 6 months, as in Fig. 2B. Genes highlighted in red are the leading-edge genes identified with GSEA, taking the top 400 up-regulated genes from the bulk sequencing of the primary neurons expressing MEG3 (fig. S10) and plotting them against the amyloid versus control fold changes of the human grafts (FDR < 0.05). (I) Schematic representation of the necroptosis inhibition in vitro using H9-derived human neurons (DIV60) with ponatinib (0.5 μM), dabrafenib (0.9 μM), and NSA (0.5 μM). (J) Analysis of neuronal cell survival using CellTiter-Glo reagent after necroptosis inhibitor treatment (n = 3). (K) Representative confocal images of grafted neurons showing pRIPK1 levels in samples obtained from the 6-month-old animals transplanted with control LV (n = 5) or the MEG3 shRNA (n = 5) transduced human NPCs. White arrows indicate pRIPK1-positive cells. Scale bars: 30 μm. (L) The human cell number was estimated from 6-month-old xenografted mice from control (n = 5) and MEG3 shRNA (n = 12) using qPCR. Values are presented as mean ± SEM. Student’s t test used in (B) and (L), one-way ANOVA with Tukey’s post hoc test for multiple comparisons used in (C), and two-way ANOVA with Dunnett’s multiple comparison test used in (J) to measure the statistical significance.

