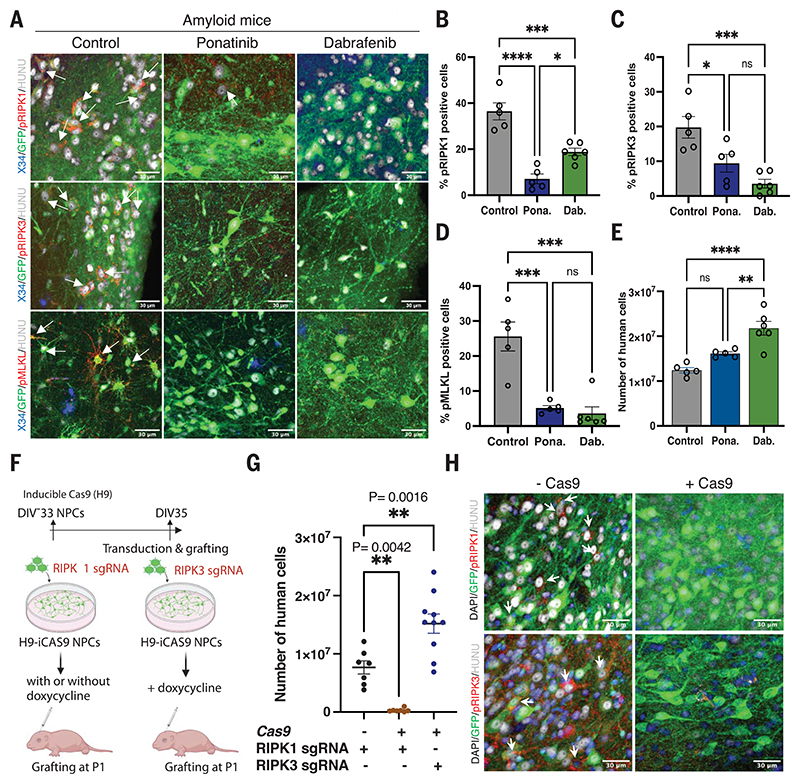
Fig. 4. Inhibition of necroptosis prevents human neuronal cell loss in vivo.
(A) Confocal images showing activated necroptotic markers pRIPKl, pRIPK3, and pMLKL in amyloid animals (n = 5) and amyloid animals treated with ponatinib (n = 5) or dabrafenib (n = 6). White arrows indicate necroptosis marker-positive neurons. Scale bars: 30 μm. (B) Quantitative representation of percent of human cells immunoreactive to pRIPKl in control (n = 5) and ponatinib-treated (Pona.; n = 5) or dabrafenib-treated (Dab.; n = 6) animals. Control versus ponatinib: P ≤ 0.0001; control versus dabrafenib: P = 0.0007; ponatinib versus dabrafenib: P = 0.015. (C) Percent of human cells showing immunoreactivity to pRIPK3 in control (n = 5) and ponatinib-treated (n = 5) or dabrafenib-treated (n = 6) animals. Control versus ponatinib: P = 0.02; control versus dabrafenib: P = 0.0007; ponatinib versus dabrafenib: P = 0.2. (D) Quantitative representation of the percent of human cells showing immunoreactivity toward pMLKL in control (n = 5) and ponatinib-treated (n = 5) or dabrafenib-treated (n = 6) animals. Control versus ponatinib: P = 0.0003; control versus dabrafenib: P = 0.0001; ponatinib versus dabrafenib: P = 0.9. (E) Quantitative estimation of the number of human cells in control (n = 5) and ponatinib-treated (n = 5) or dabrafenib-treated (n = 6) grafted mice at 6 months after transplantation. Control versus ponatinib: not significant; control versus dabrafenib: P = 0.0001; ponatinib versus dabrafenib: P = 0.007. (F) Schematic representation of the RIPK1 and RIPK3 KO generation and transplantation. (G) Number of neurons surviving from 6-month-old mice transplanted with RIPK1 single guide RNA (sgRNA) without doxycycline (n = 7) or RIPK1 sgRNA with doxycycline (n = 7) or RIPK3 sgRNA with doxycycline (n = 10) using qPCR. (H) Representative immunofluorescence analysis of phosphorylated necroptosis markers pRIPK1 (n = 3) pRIPK3 (n = 3) from 6-month-old mice transplanted with RIPK1 sgRNA or RIPK3 sgRNA without and with Cas9 induction, as indicated. White arrows indicate pRIPK1- or pRIPK3-positive cells. Scale bars: 30 μm. Values are presented as mean ± SEM. One-way ANOVA with Tukey’s post hoc test for multiple comparisons was used in (B) to (E) and (G).

