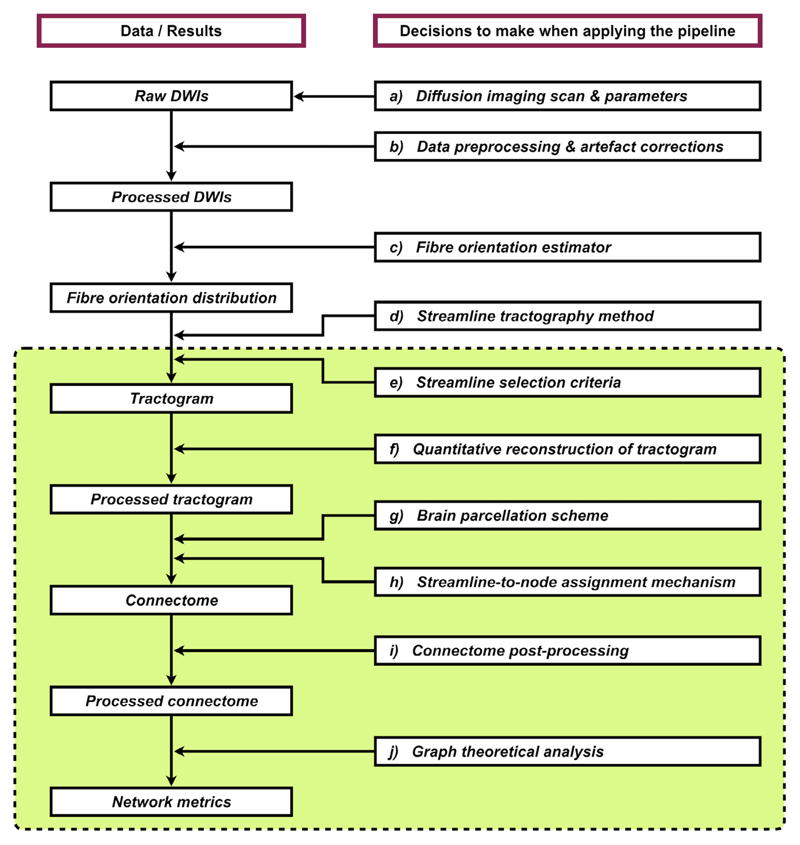
Figure 2.
An example processing workflow for generating an individual’s structural connectome using diffusion MRI data (an expanded version of the left branch in Fig. 1). Left column: Each box denotes the raw, interim, or final products of this pipeline. Right column: Each box describes the class of data processing involved in this pipeline. Within each procedure, there are many relevant options and parameters that have to be considered, where each choice can potentially affect the final output network metrics and the inference drawn from this technique. This shows the complexity of data processing in tractography-based structural connectomics research. The green box indicates the processing steps that are specifically discussed in the present article.

