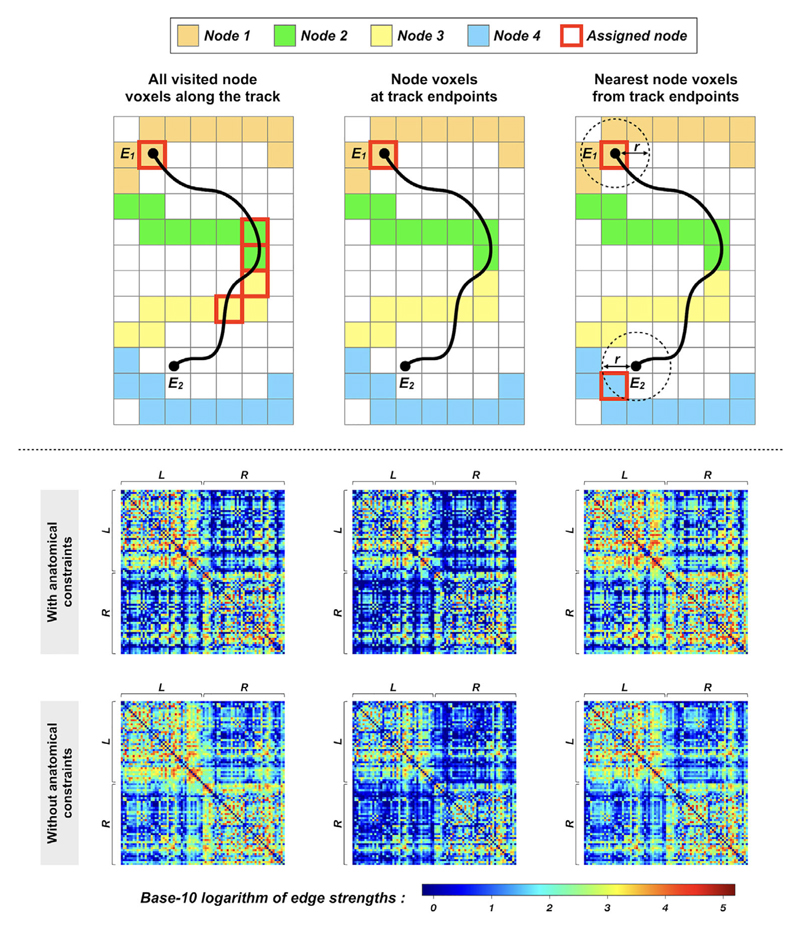
Figure 6.
The effects of streamline-to-node assignment mechanisms on connectome construction, illustrated by a toy example (upper panel) and human image data (bottom panel): Upper panel: Examples of mechanisms used to assign streamlines to network nodes—streamlines shown in black; streamline endpoints denoted as E1 and E2; network nodes shown as colored voxels. The colored voxels added with red borders indicate the assigned nodes. As shown in this figure, even for an identical streamline, the assigned nodes (and therefore the outcome connectivity) among those streamline-to-node assignment methods are all different, suggesting that the design of such a mechanism can have direct influence on connectome quantification (see Ref. 44 for detailed explanations).
Bottom panel: Group-averaged connectivity matrices generated from a cohort of healthy subjects. Probabilistic tractograms are generated; nodes are defined by Desikan–Killiany atlas48; edges are defined by weighted streamline counts as provided by quantitative tractogram processing.55 In the upper row, the matrices are obtained using tractography with anatomical constraints, where the three streamline-to-node assignment mechanisms shown in the upper panel are used for connectome construction. For comparisons, the bottom row shows the results without anatomically-constrained tracking. L and R denote left and right hemispheres, respectively. The outcome connectivity pattern and connectomic metrics are significantly different among these connectivity matrices,44 highlighting the necessity of selecting an appropriate strategy for connectome construction. This figure is adapted from Ref. 44 with copyright permission.

