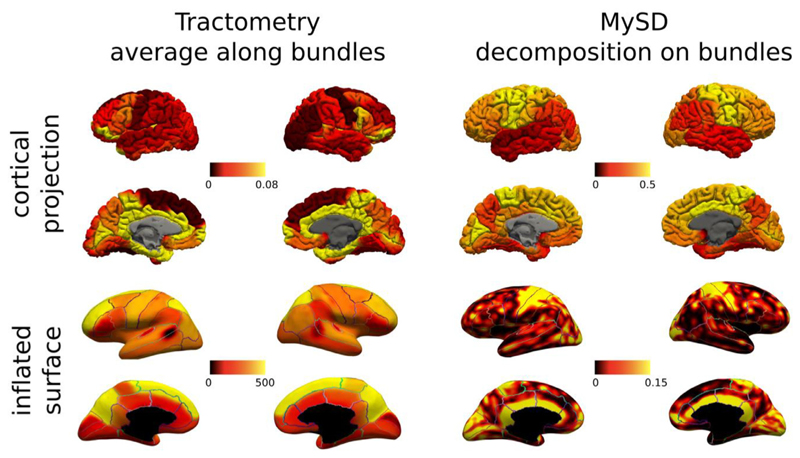
Fig. 5.
Cortical and inflated projections obtained for the same subject using MWF maps coupled with tractometry (left) and MySD (right). To enable the visual comparison between different cortical areas on the inflated surfaces, we overlayed also the boundaries of Desikan-Killiany parcellation. The contrast obtained with MySD is in line with the known pattern of myelin in cortex, while tractometry, because of its assumptions, cannot reproduce the expected behavior. We also note that the color bars of cortical projections and inflated surfaces are different because, while cortical projections were computed by summing up all the contributions of streamlines starting/ending in those ROIs and dividing by the ROI volume (connectivity-like approach), the inflated surfaces were created by summing up all the values of streamlines ending in the same voxel and using 5 mm smoothing (voxel-based approach). Color bars are without units because they refer to fractions of myelin.

