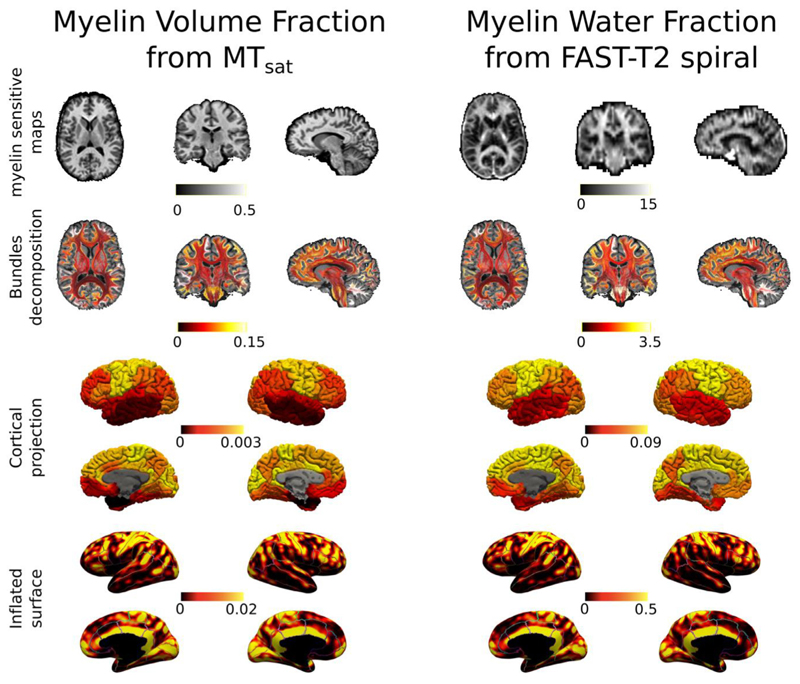
Fig. 7.
Same subject different myelin maps. On the left, axial, coronal, and sagittal views of myelin-sensitive map, bundles color-coded by their BMF as well as cortical and inflated projections obtained with the proposed method on the tractogram and the MVF map estimated from the MTsat acquisition. On the right, axial, coronal, and sagittal views of myelin-sensitive map, bundles color-coded by their BMF as well as cortical and inflated projections obtained with the proposed method on the tractogram and the MWF map estimated from the FAST-T2 spiral acquisition. To facilitate the visual comparison between different cortical areas on the inflated surfaces, we also overlaid the boundaries of Desikan-Killiany parcellation. Color bars are without units because they refer to fractions of myelin (between 0 and 1 for MVF and between 0 and 100 for MWF).

