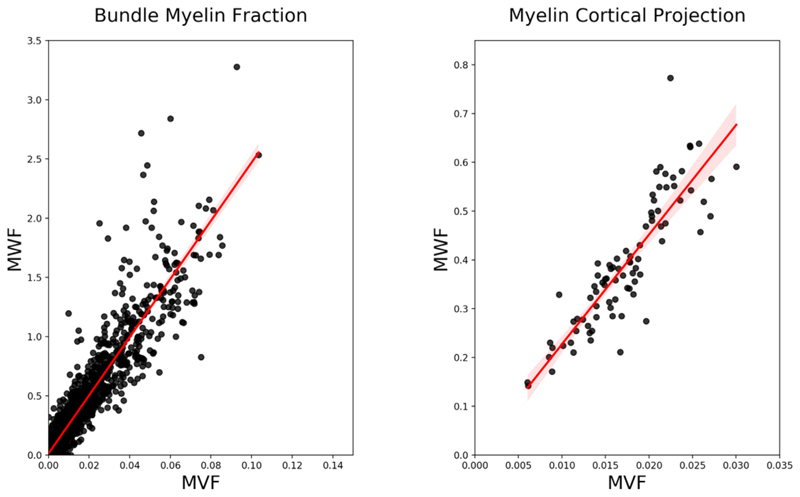
Fig. 8.
Correlations between bundles (defined as connections between cortical ROIs thus resulting in (85 × 85–85)/2 points) and cortical projections values (84 points) derived with MySD applied on MWF and MVF maps of one subject in our dataset. The linear fit is showed in red with shadowed 95% confidence interval.

