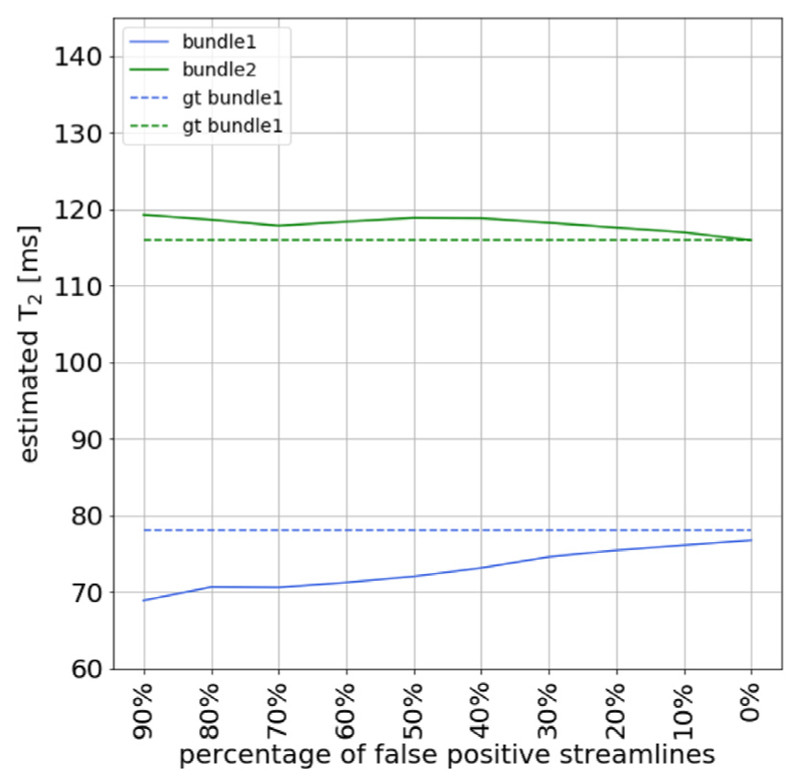
Fig. 4.
Effect of introducing false positive streamlines in the simulated phantom with two fiber bundles with different T2 values: T2,B1 = 78 ms (in red color) and T2,B2 = 116 ms (in green color), respectively. The figure shows the effect of the COMMIT-T2 estimation when a different percent of false positives is introduced and the same numbers of true-positives are removed, while keeping constant the number of streamlines in the dictionary. The ground-truth T2 values are displayed in dashed lines as a reference.

