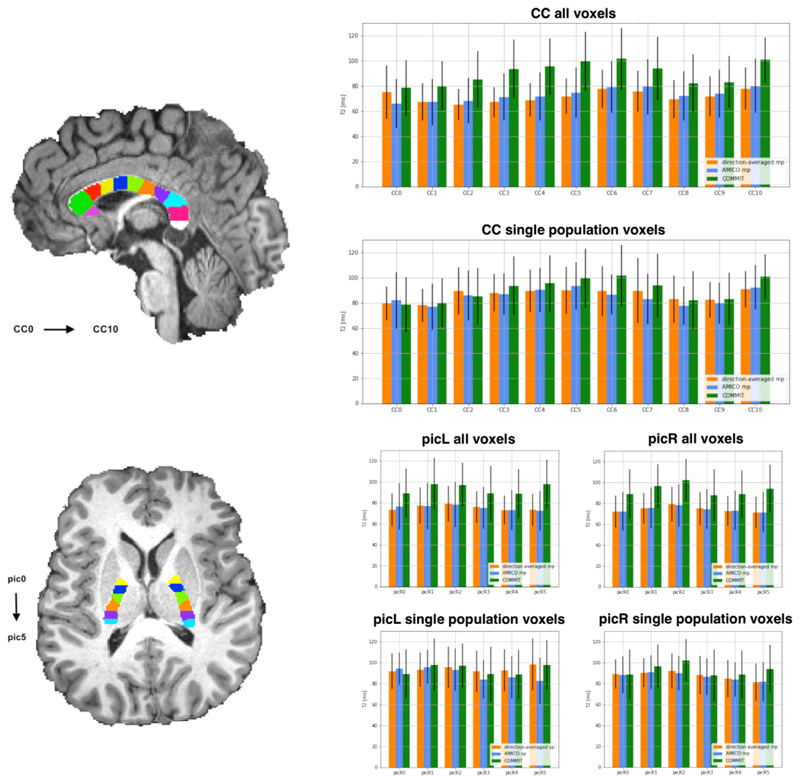
Fig. 5.
T2 estimations using the direction-averaged, AMICO-T2, and COMMIT-T2. The analysis is performed on two commonly-studied white matter fasciculus: the Corpus Callosum (CC) and the Posterior limb Internal Capsule (PIC). The CC was subdivided into 11 ROIs while the PIC was subdivided into 6 ROIs. The ROIs shown in the figure are used to separate the bundles passing through them, i.e. they are not the ROIs from which the measurements are extracted. A comparison is performed for the three methods considering the mean and standard deviation of the voxels appertaining to a bundle. Furthermore, we compared all the voxels of the bundles, multiple populations, and voxels in which only one fiber population is present (defined as having a voxel-based fractional anisotropy (FA) greater than 0.7). Bar height corresponds to mean value and whiskers represent the standard deviation across voxels.

