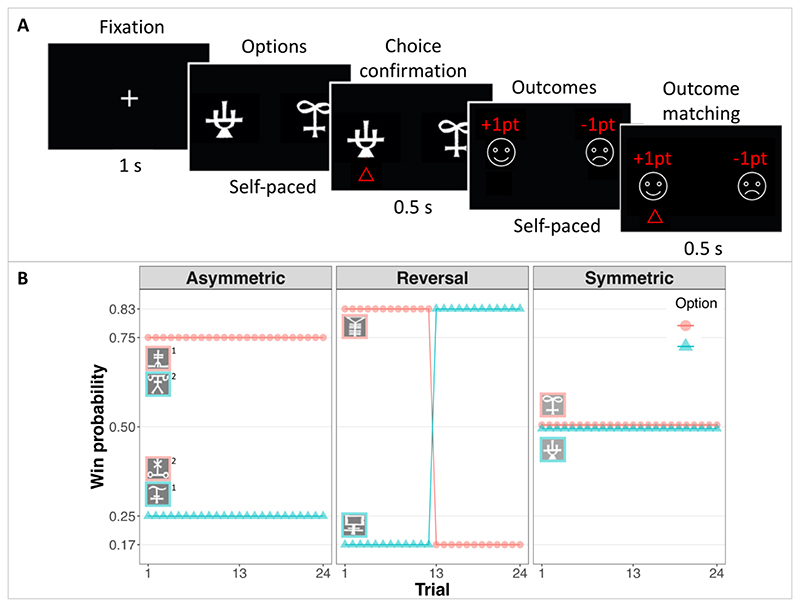
Fig. 1.
A. Trial structure. After a fixation cross, participants chose between one of two symbols by pressing one of two keys and their choice was confirmed by the appearance of a red arrow under the chosen option. The outcomes of both the chosen and the unchosen options were then revealed. To move on to the next trial, participants had to press the same key as before, thus matching the outcome. Decision times and outcome observation times were self-paced. B. Experimental conditions. Participants were told that some symbols might lead to winning more often than others. They were asked to try to discover which option was more advantageous by trial and error. Symbols were presented in fixed pairs, for 24 trials. There were 4 pairs of symbols in three conditions. In the asymmetric condition, one symbol led to winning more frequently than the other throughout the session. In the reversal condition, one symbol led to winning more frequently than the other for the first half of the trials, but these contingencies reversed in the second half. In the symmetric condition, both symbols were equally advantageous. The asymmetric condition was repeated twice, each time with a new pair of symbols. The reversal and symmetric conditions each occurred once, each time with a unique pair of symbols. The exact probabilities of winning 1 point for each option are shown on the y-axis, for each condition (losing occurred with the complimentary probability), as function of the trial. Symbol pairs were presented in an interleaved fashion.

