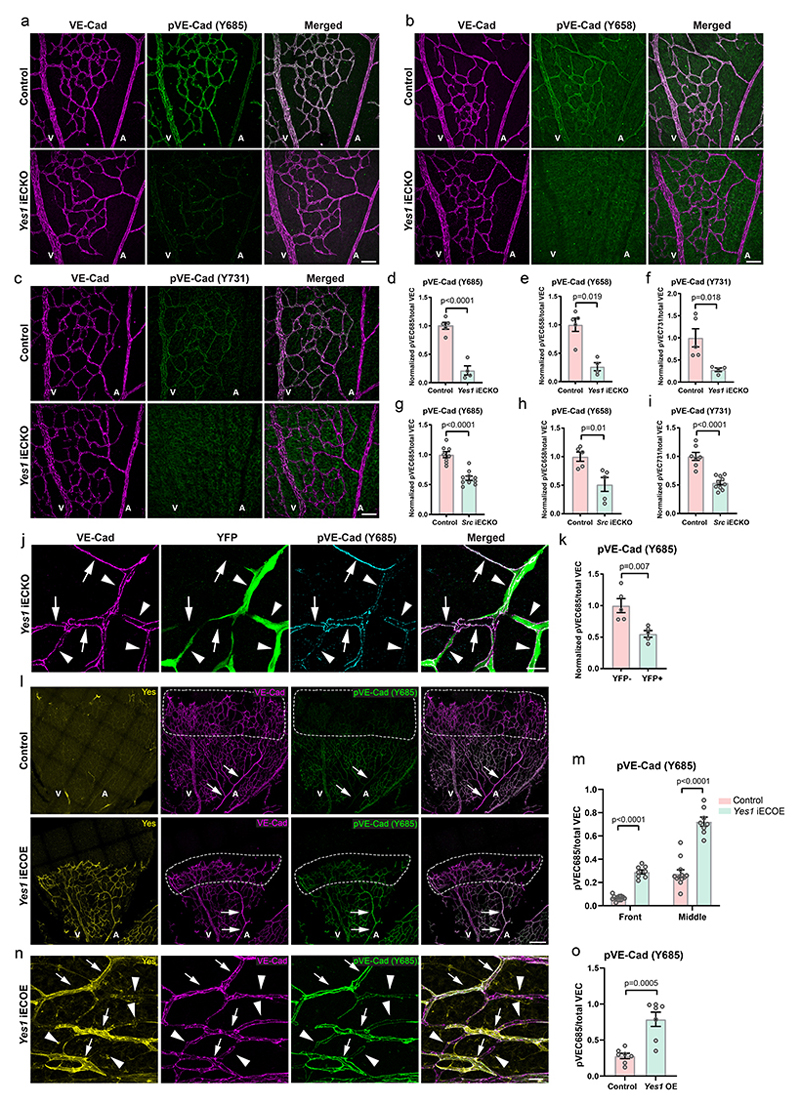
Figure 2. Yes phosphorylates VE-cadherin.
(a-c) Immunofluorescence of Yes1 iECKO (Yes1 fl/fl, Cdh5CreERT2+) and control (Yes1 fl/fl, Cdh5CreERT2-) P6 retinas showing total VE-cadherin (magenta) and phosphorylated VE-cadherin (green): pY685 (a), pY658 (b) and pY731 (c). Scale bars, 50 μm. (d-f) Quantification of pVE-cadherin (Y685) (d), pVE-cadherin (658) (e) and pVE-cadherin (731) (f) levels normalized to total VE-cadherin in control and Yes1 iECKO littermate P6 retinas. Control, n=5; Yes1 iECKO, n=4. (g-i) Quantification of pVE-cadherin levels normalized to total VE-cadherin in P6 retinas of Src iECKO (Src fl/fl, Cdh5CreERT2+) and control (Src fl/fl, Cdh5CreERT2-) mice. (g) pVE-cadherin (Y685). Control, n=8; Src iECKO, n=10. (h) pVE-cadherin (Y658). Control, n=5; Src iECKO, n=5. (i) pVE-cadherin (731). Control, n=7; Src iECKO, n=10. (j) Immunofluorescence showing the correlation between levels of pY685 VE-cadherin and YFP+ Yes1-deficient ECs in a P6 retina with chimeric recombination (100 μg tamoxifen/mouse) at P3. Arrows, YFP-ECs; arrowheads, YFP+ ECs. Scale bar, 20 μm. (k) Quantification of pY685 VE-cadherin levels in YFP-and YFP+ ECs. n=5 mice. (l) Immunofluorescent images showing Yes (yellow), VE-cadherin (magenta) and pY685 VE-cadherin (green) in control (H11-STOP-Yes1-, Cdh5CreERT2+; upper panel) and inducible Yes1 overexpression model (iECOE; lower panel) retinas at P6. Arrows indicate arteries. Dashed lines indicate sprouting front. Scale bar, 200 μm. (m) Quantification of pY685 VE-cadherin in the front and middle parts of control and Yes1 iECOE retinas. Control, n=12; Yes1 iECOE, n=8. (n) Immunofluorescent staining of pY685 VE-cadherin in Yes1-overexpressing ECs in a P6 Yes1 iECOE retina with chimeric recombination. Arrows indicate ECs with Yes1 overexpression, and arrowheads indicate ECs without recombination. Scale bar, 20 μm. (o) Quantification of pY685 VE-cadherin in Yes1-overexpressing ECs and their neighboring non-recombined ECs, as shown in (n), n=7 mice. V, vein; A, artery. Bar graphs show mean ± SEM; two-tailed Student’s t-test.

