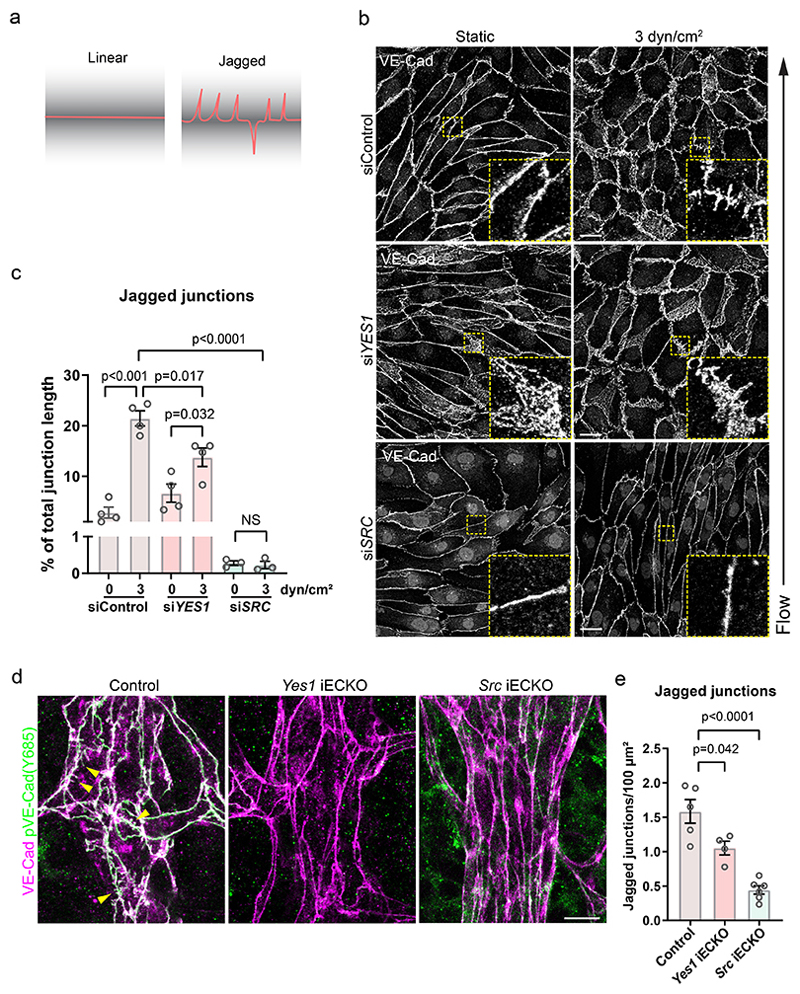
Figure 4. Adherens junction morphology.
(a) Schematic outline of linear and jagged adherens junction morphology based on VE-cadherin immunostaining. (b) Immunostaining of VE-cadherin in HUVECs transfected with control or YES1 or SRC siRNA and cultured under static or 3 dyn/cm2 flow conditions. Boxed regions show representatives of altered VE-cadherin morphologies, magnified to the lower right. Scale bars, 20 μm. (c) Quantification of jagged junctions as shown in (b), given as junction length in % of total. Bar graphs show mean ± SEM with individual data points. siControl; n=4, siYES1; n=4, siSRC; n=3 independent experiments. (d) Adherens junction morphology in veins of retinal vessels at P6 illustrated by immunostaining of VE-cadherin (magenta) and pY685 VE-cadherin (green). Yellow arrowheads indicate jagged junctions. Scale bar, 10 μm. (e) Quantification of jagged structures/100 μm2 VE-cadherin area in control (Yes1 fl/fl, Cdh5CreERT2-), Yes1 iECKO and Src iECKO mouse retinas. Control; n=5 mice, Yes1 iECKO; n=4 mice, Src iECKO; n=6 mice. Bar graphs show mean ± SEM; two-tailed Student’s t-test.

