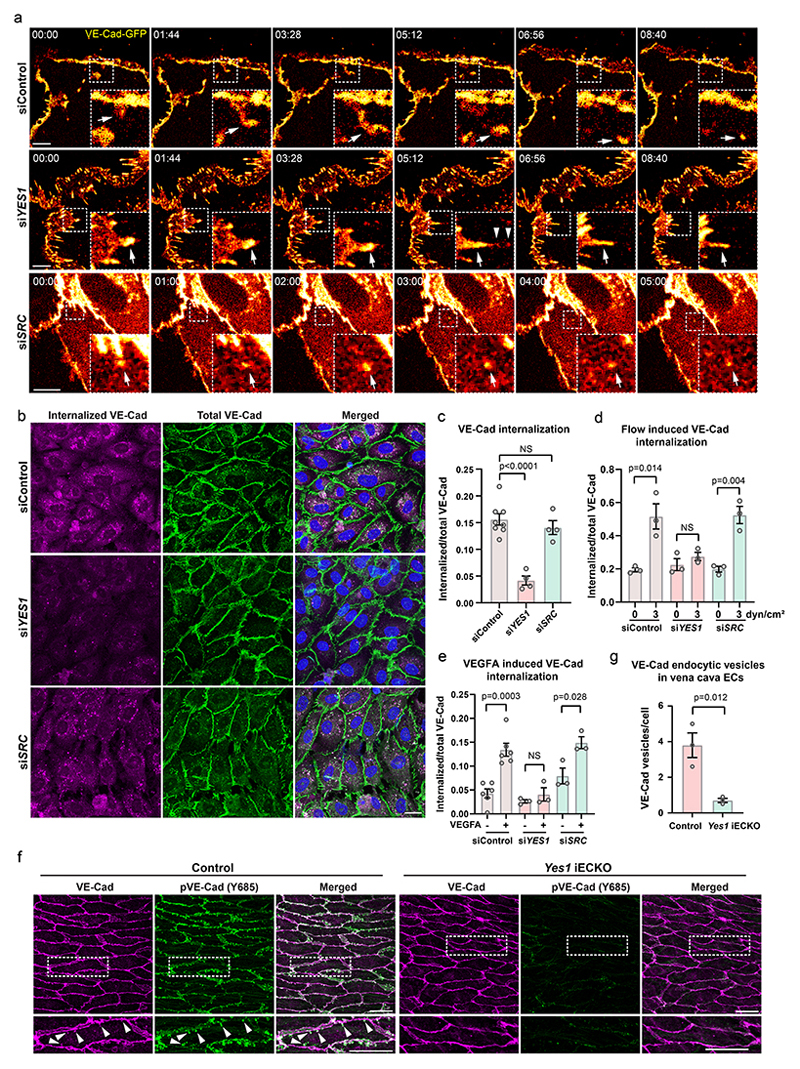
Figure 5. Yes is required for VE-cadherin internalization.
(a) Static images from live imaging time series of HUVECs expressing GFP-tagged VE-cadherin. Boxed areas highlight examples of different dynamics of VE-cadherin and are shown enlarged in the lower right. Arrows in the upper (siControl) and lower (siSRC) panel indicate internalized VE-cadherin vesicles. Arrows in the middle panel (siYES1) indicate a junctional VE-cadherin cluster, while arrowheads show detachment and internalization of VE-cadherin from the cluster. Timestamps are min:sec. Scale bars, 10 μm. (b) Antibody feeding assay showing internalized VE-cadherin (magenta) in control, siYES1 and siSRC HUVECs co-stained with total VE-cadherin (green) and nuclei (blue). Scale bar, 20 μm. (c) Quantification of internalized/total VE-cadherin in control, siYES1 and siSRC static HUVECs. Control; n=8, siYES1; n=4, siSRC; n=4 independent experiments. (d) Quantification of flow-induced internalized/total VE-cadherin in control, siYES1 and siSRC HUVECs. n=3 independent experiments. Representative images are shown in Extended Data Fig. 12a. (e) Quantification of internalized/total VE-cadherin in control, siYES1 and siSRC HUVECs treated with VEGFA or not for 3 h. n=3 independent experiments. Representative images are shown in Extended Data Fig. 12b. (f) Internalized VE-Cadherin vesicles at the juxtamembrane regions in mouse vena cava ECs shown by immunostaining of VE-Cad (magenta) and pY685 VE-Cad (green). Cells highlighted in boxes are shown enlarged below. Arrowheads indicate internalized VE-Cad vesicles. Scale bars, 20 μm. (g) Quantification of internalized VE-Cad vesicles/cells in control and Yes1 iECKO vena cava ECs. n=3 mice for each group. Bar graphs show mean ± SEM; two-tailed Student’s t-test.

