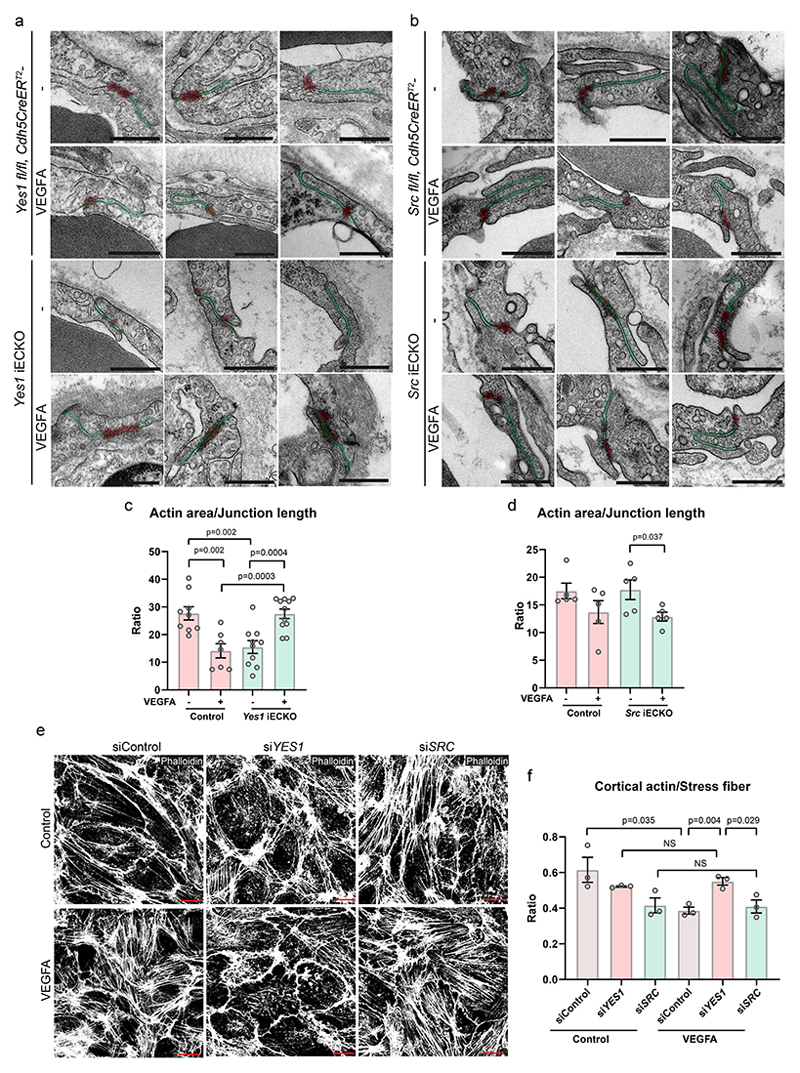
Figure 6. Cell-cell junctions and actin organization.
(a, b) Endothelial junctions in control, Yes1 iECKO or Src iECKO mouse ear dermis vessels after intradermal injection of saline or VEGFA164, visualized by transmission electron microscopy. Endothelial cell junction length is highlighted in green, and electron dense junctional area (cortical actin-rich domain) is in red. Scale bars, 500 nm. (c) Quantification of actin area/junction length in control (Yes1 fl/fl, Cdh5CreERT2-) and Yes1 iECKO mice. Saline-treated control mice, n=9; VEGFA-treated control mice, n=7; saline-treated Yes1 iECKO mice, n=10; VEGFA-treated Yes1 iECKO mice, n=11. 2-40 junctions were analyzed in each mouse. (d) Quantification of electron dense junctional area/junction length in control (Src fl/fl, Cdh5CreERT2-) and Src iECKO mice. n=5 mice for each group. (e) Staining with phalloidin shows the arrangement of actin stress fibers and cortical actin in HUVECs treated with control, Yes or Src siRNA followed by VEGFA stimulation for 15 min. Scale bars, 20 μm. (f) Quantification of the integrated intensity of actin stress fibers normalized to cell numbers in control, Yes- or Src-silenced HUVECs. n=3 independent experiments. Bar graphs show mean ± SEM; two-tailed Student’s t-test.

