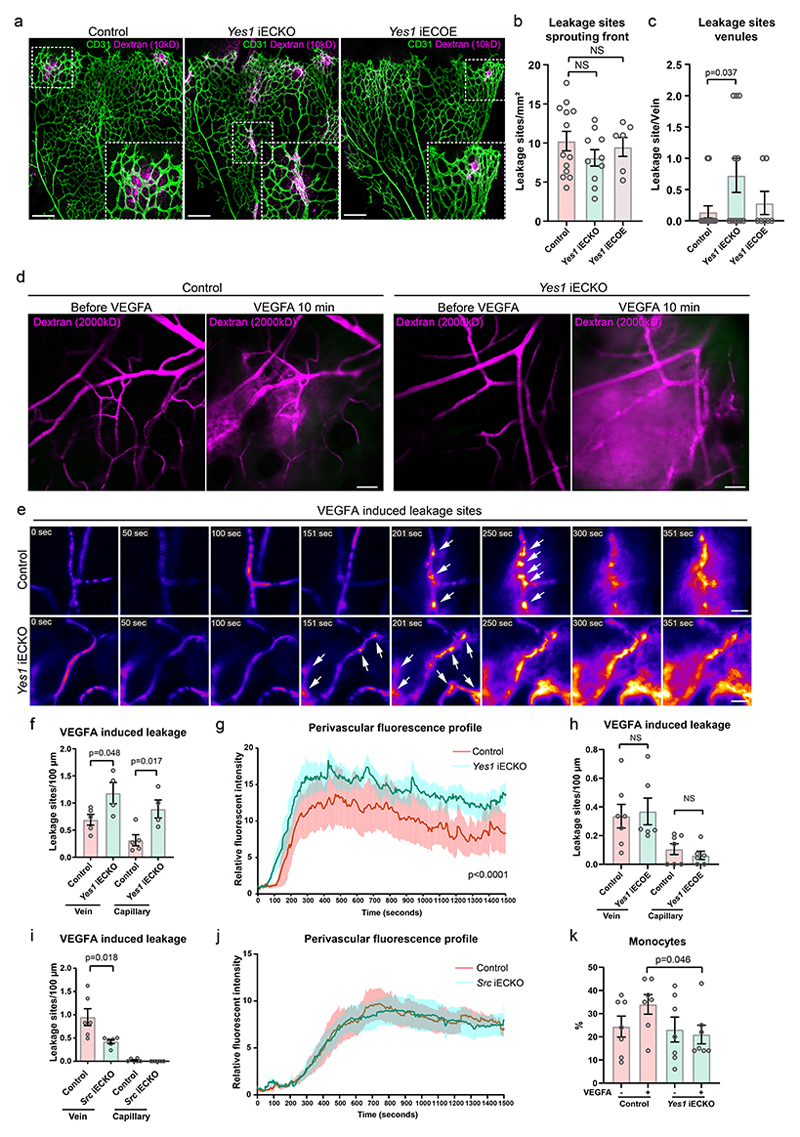
Figure 7. Yes-deficiency leads to loss of vascular integrity.
(a) Perivascular leakage of 10 kD dextran (magenta) in fixed P6 retinas of control (Yes1 fl/fl, Cdh5CreERT2-), Yes1 iECKO and Yes1 iECOE mice. Vessels shown by CD31 immunostaining (green). Boxed leakage sites shown in magnification. Scale bars, 200 μm. (b) Quantification of leakage sites at the sprouting front. Control, n=9 retinas; Yes1 iECKO, n=10 retinas; Yes1 iECOE, n=6 retinas, two-tailed Student’s t-test. (c) Quantification of leakage sites in retinal veins. Control, n=14 veins/ 9 retinas; Yes1 iECKO, n=11 veins/10 retinas; Yes1 iECOE, n=7 veins/ 6 retinas; two-tailed Student’s t-test. (d) Static images from intravital time series imaging of mouse ear dermal vessels before and 10 min after intradermal VEGFA injection. Leakage visualized by the perivascular accumulation of 2000 kDa dextran (magenta). Scale bars, 50 μm. (e) Heat map images of individual leakage sites (arrows) after VEGFA injection. Scale bars, 20 μm. (f) Quantification of individual leakage sites at veins and capillaries in control and Yes1 iECKO mice induced by VEGFA. Control, n=5 mice, Yes1 iECKO, n=4 mice. (g) VEGFA-induced changes in perivascular fluorescence intensity measured at 2-second intervals for 1500 seconds. Curves show mean values of 8 leakage sites from 5 control mice and 10 sites from 4 Yes1 iECKO mice; two-way ANOVA. (h) Quantification of individual leakage sites at veins and capillaries of control (H11-STOP-Yes1-, Cdh5CreERT2+) and Yes1 iECOE mice induced by VEGFA. Control, n=7 mice, Yes1 iECOE, n=6 mice. (i) Quantification of individual leakage sites at veins and capillaries in the ear dermis of control (Src fl/fl, Cdh5CreERT2-) and Src iECKO mice after VEGFA injection. Control, n=6 mice, Src iECKO, n=6 mice. (j) VEGFA-induced changes in perivascular fluorescence intensity measured at 2-second intervals for 1500 seconds. Control, n=6 mice, Src iECOE, n=6 mice; two-way ANOVA. (k) FACS analysis of monocyte/macrophage (CD11b+, LY6G-) extravasation in peritoneal fluid from control and Yes1 iECKO mice 24 h after i.p. injection with saline or VEGFA, n=7 mice for each group. Bar graphs show mean ± SEM; two-tailed Student’s t-test.

