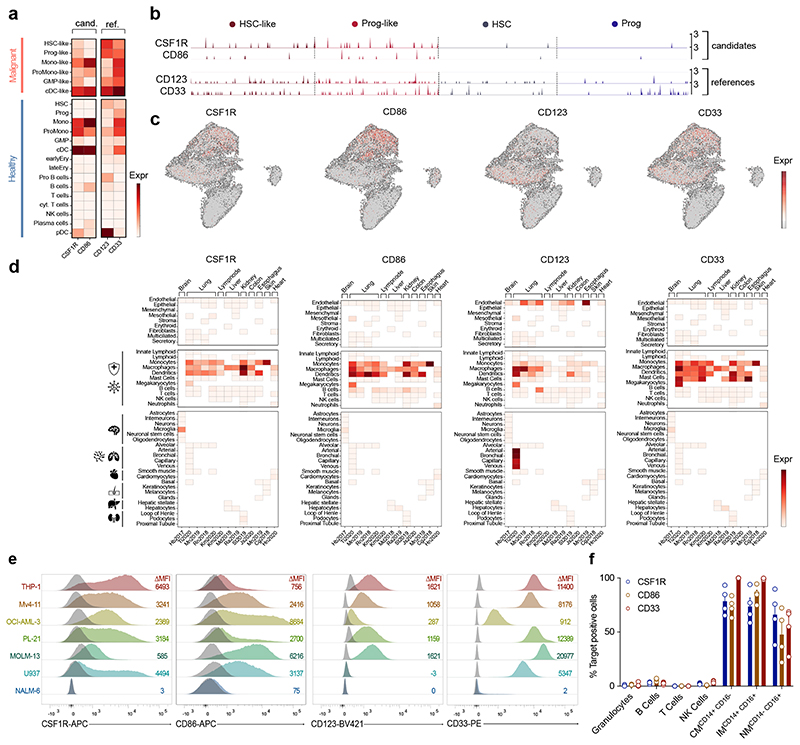
Figure 2. CSF1R and CD86 are preferentially expressed on malignant HSPC-like compared to healthy HSPC and off-tumor expression is restricted to infiltrating or tissue-resident immune cells.
(a) Expression of target and reference genes (CD123, CD33) on single healthy and malignant cell types. Normalized expression values were log-transformed and scaled to unit variance. (b) Expression of CSF1R and CD86 target genes in malignant (HSC-like, Prog-like; left) and healthy (HSC, Prog; right) stem cells. For visualization purposes, normalized expression values of healthy HSPC and a random subsample of malignant HSPC were log-transformed and scaled to unit variance. Each peak corresponds to a cell, peak height indicates expression intensity. (c) Expression of CSF1R and CD86 target genes in healthy and malignant cells of 15 AML patients. Normalized gene expression values were log-transformed and visualized in a UMAP embedding. (d) Single-cell cross-organ off-target transcriptomic atlas screening for target (CSF1R, CD86) and reference (CD123, CD33) genes. Single-cell transcriptomic atlas consists of a total of 544,764 sequenced cells comprising 9 different organs. Each field represents the mean expression value per cluster. Blank fields indicate cell types not present in a study. (e) Representative flow cytometric images of target gene expression on a panel of six different AML cell lines or NALM-6 control cells. Staining for target antigens was carried out at least twice. (f) Expression of target antigens on human immune cell population quantified by flow cytometry. Data are mean ± s.e.m. of four different donors. CM, classical monocytes; IM, intermediate monocytes; NM, non-classical monocytes.

