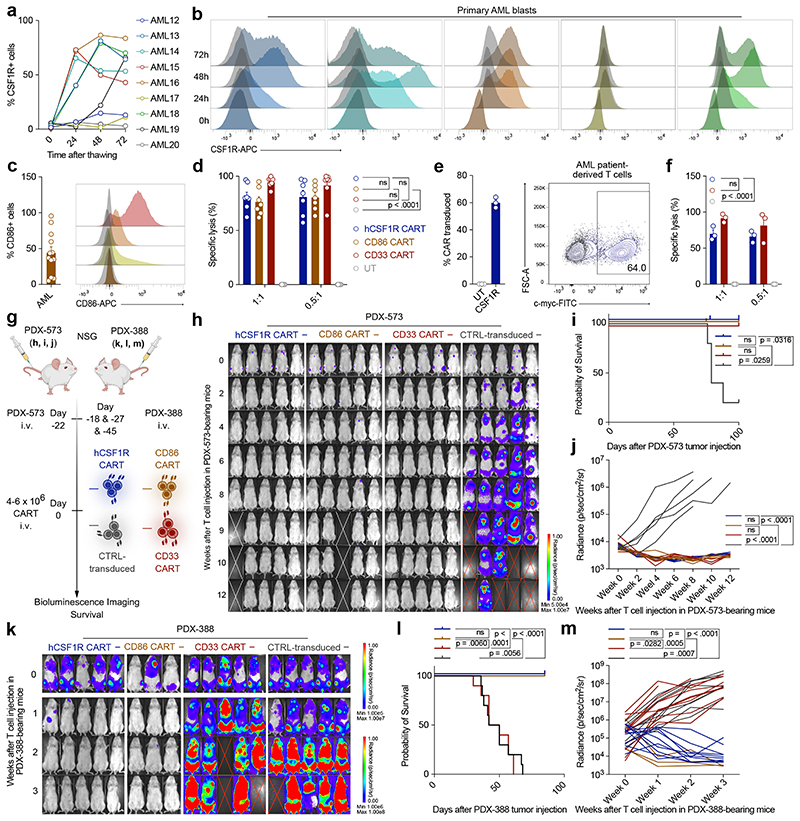
Figure 5. CSF1R and CD86 are readily detected on primary AML samples and hCSF1R CART show efficient lysis of primary AML samples in vitro and in vivo.
(a) Expression of CSF1R following thawing of primary AML samples over 72 h. Each line represents one patient. (b) Representative histograms of CSF1R (colored) expression on primary AML samples over time in comparison to isotype control (grey). (c) Expression of CD86 on primary AML samples. Each dot represents one patient. Left: Percentage positive cells gated to isotype. Right: Representative histograms of four different patients. Data are mean ± s.e.m of eleven different primary AML samples. (d) hCSF1R, CD86 or CD33 CART or untransduced T cells were co-cultured with primary AML samples for 72 hours. Specific lysis was assessed using flow cytometry. Data are mean ± s.e.m of seven different primary AML samples. Indicated p-values apply to E:T ratio 0.5:1. (e) hCSF1R CAR construct transduced into T cells of AML patients. Left: Transduction efficiency of AML patient-derived CAR-T cells. Right: Representative flow cytometric image. (f) Patient-derived CART or untransduced T cells were co-cultured with primary AML samples of the same donor. Experiments were carried out as outlined in (d). (e, f) Data are mean ± s.e.m of three different autologous donors. (g) Summary of treatment scheme used for in vivo experiments. (h - j) BLI images (h), survival curves (i) and BLI quantification of tumor-burden (j) of PDX-573 tumor-bearing mice injected with 6 x 10⁶ hCSF1R, CD33 CART or control-transduced T cells (n = 5 mice per group). (j) P-values calculated at week 8. (h) White cross, censored mice; red cross, mice succumbed to disease. (k - m) BLI images (k), survival curves (l) and BLI quantification of tumor-burden (m)of PDX-388 tumor-bearing mice injected with 6 x 10⁶ hCSF1R, CD86, CD33 CART, control-transduced T cells or PBS. (n = 3 - 10 mice per group). CD86 CART treatment was carried out separately. For all experiments statistical significance was calculated using two-way ANOVA with Šidák multiple comparison correction. For Kaplan-Meier-Curves, statistical significance was calculated with log-rank test.

