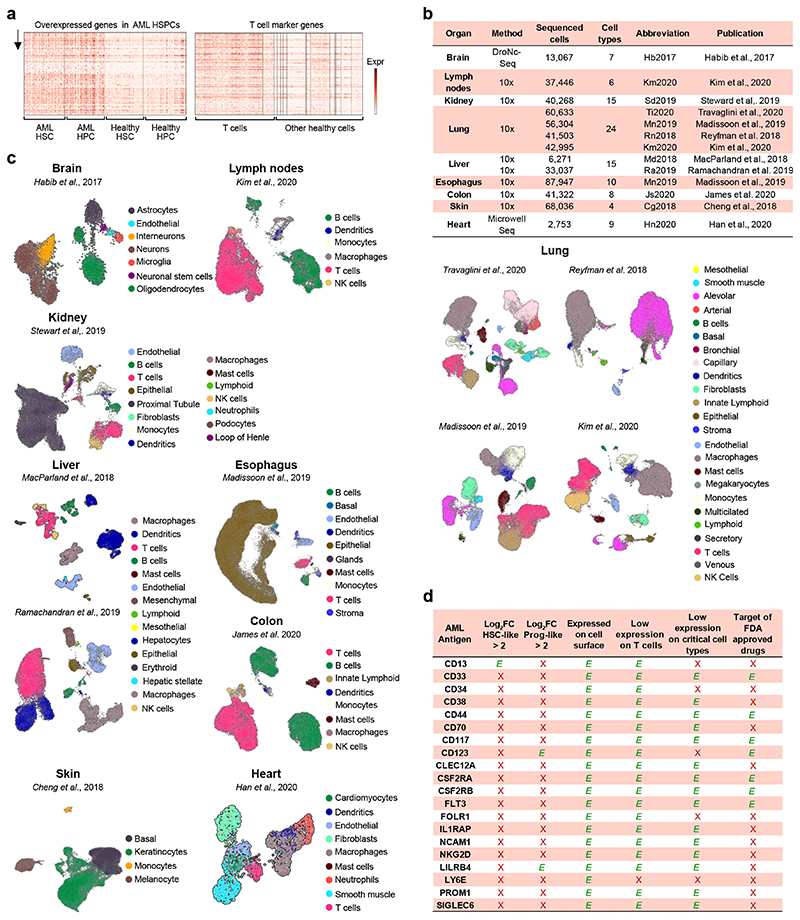
Extended Data Figure 1. Summary of the cross-organ off-target transcriptomic atlas (COOTA).
(a) Top 100 overexpressed genes in AML HSPC (left) and healthy T cells (right) from differential expression analysis. Normalized expression values were logarithmized and scaled to unit variance. (b) Overview of 11 scRNA-seq datasets of various healthy tissues used to quantify off-target antigen expression. (c) UMAP plots of 11 scRNA-seq datasets with colors highlighting clustering into respective cell types. Cell annotations were provided by the authors of the respective studies. (d) Current CAR targets in AML were cross-referenced to filters used for the single cell-based target screening approach. OE HSC-/Prog-like: overexpressed on HSC-/Prog-like cells with log fold change > 2 and FDR-adjusted p ≤ 0.01, using a t-test with overestimated variance. Red cross: Antigen did not fulfill the respective threshold or criteria. Green check: Thresholds or criteria were passed.

