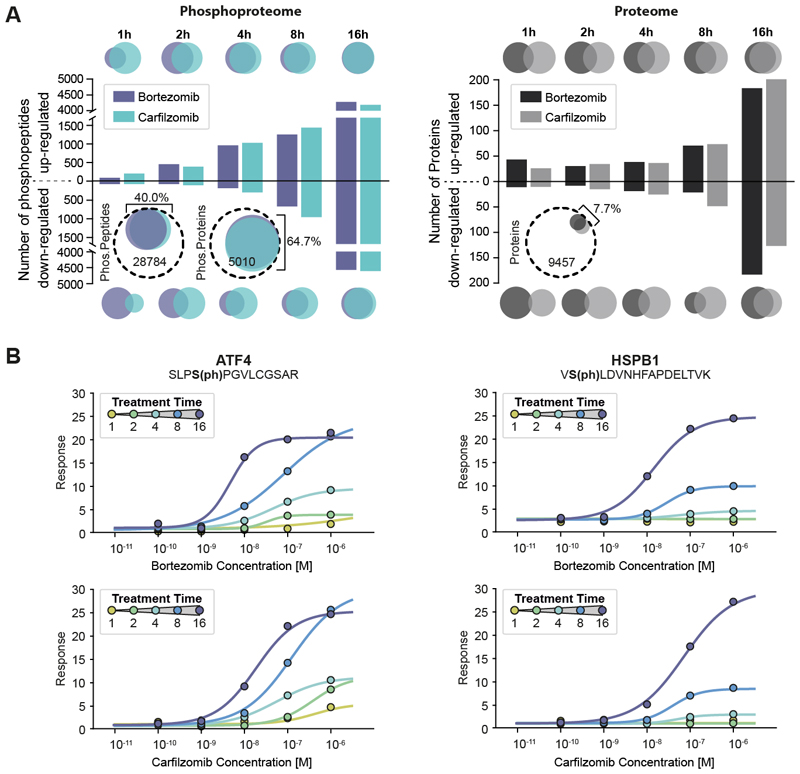
Fig. 2. Two-dimensional (2D) decryptM analysis of covalent proteasome inhibitors highlighting how cells mount a massive stress response.
(A) Left panel: Bar plot showing the number of dose-dependently up- or down-regulated phosphopeptides at a given time of treatment with bortezomib and carfilzomib in RPMI8226 cells. The Venn diagrams at the top and bottom illustrate the number (size) and overlap of phosphopeptides between the two drugs at a given time point. The circled Venn diagrams illustrate the total (dashed line) and regulated fraction (colored circles) of phosphopeptides and proteins detected for the two drugs. Right panel: same as left panel but for protein expression. (B) Examples for 2D decryptM profiles for bortezomib (top row) and carfilzomib (bottom row) for two exemplary phosphopeptides on proteins involved in cellular stress responses (AFT4, HSPB1).

